

Procurement optimization dashboard showing suppliers and saving powerpoint template


Try Before you Buy Download Free Sample Product
 Impress Your
 Audience
Editable
of Time


Our Procurement Optimization Dashboard Showing Suppliers And Saving Powerpoint Template are topically designed to provide an attractive backdrop to any subject. Use them to look like a presentation pro.
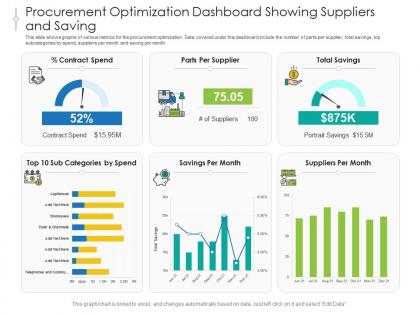
This slide shows graphs of various metrics for the procurement optimization. Data covered under this dashboard include the number of parts per supplier, total savings, top subcategories by spend, suppliers per month and saving per month. This is a Procurement Optimization Dashboard Showing Suppliers And Saving Powerpoint Template drafted with a diverse set of graphics, that can be reformulated and edited as per your needs and requirements. Just download it in your system and make use of it in PowerPoint or Google Slides, depending upon your presentation preferences.
People who downloaded this PowerPoint presentation also viewed the following :
Procurement optimization dashboard showing suppliers and saving powerpoint template with all 2 slides:
Use our Procurement Optimization Dashboard Showing Suppliers And Saving Powerpoint Template to effectively help you save your valuable time. They are readymade to fit into any presentation structure.

Most Relevant Reviews
-
Informative design.
-
Easily Editable.
-
Colors used are bright and distinctive.
-
Attractive design and informative presentation.