


Production Cost Composition Powerpoint Presentation Slides




Try Before you Buy Download Free Sample Product
 Impress Your
 Audience
 100%
100% Editable
 Save Hours
 of Time


Introducing Production Cost Composition PowerPoint Presentation Slides. The presentation showcases the total cost of production, which are classified into categories of direct and indirect costs. The manufacturing costs PPT slideshow depicts elements of prime costs such as direct material costs, direct labor costs, other prime costs including opening and closing stock of material. Take the advantage of production cost PowerPoint slide deck and present the elements of indirect cost by explaining production overheads, office, and administration overheads, selling overheads, distribution overheads, etc. Showcase the detailed analysis of the inventory of different products by including information on costing and unit sold. Also, the cost sheet helps to show a detailed description of the cost of goods sold. Utilize our easily customizable cost components PPT templates and analyze the cost sheet ratio. Download this ready-to-use production cost components PPT slides and understand the types of cost of production and methods to calculate the cost.
People who downloaded this PowerPoint presentation also viewed the following :
Content of this Powerpoint Presentation
Slide 1: This slide introduces Production Cost Composition. State your Company name and begin.
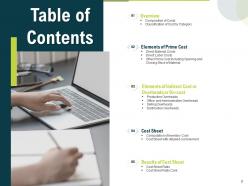
Slide 2: This slide displays Table of Contents.
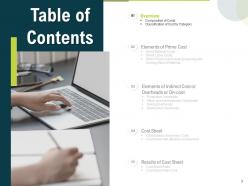
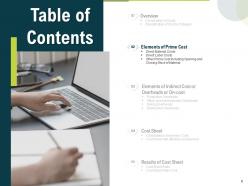
Slide 3: This slide shows Table of Contents
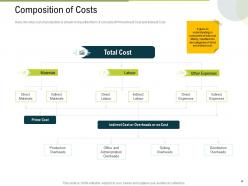
Slide 4: This slide presents Composition of Costs.
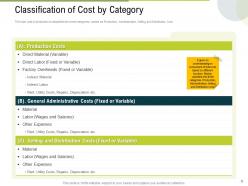
Slide 5: This slide gives an understanding on component of total cost, based on different function. Mainly, classified into three categories, Production, Administration, Selling and Distribution cost
Slide 6: This slide displays Table of Contents.
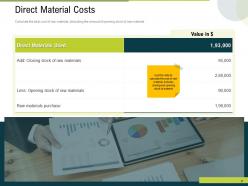
Slide 7: Use this slide to calculate the cost of raw material, includes closing and opening stock of material
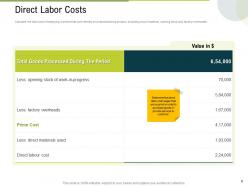
Slide 8: This slide will help to Calculate the total cost of employing workers that work directly on a manufacturing product, excluding cost of material, opening stock and factory overheads.
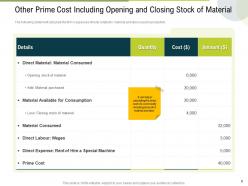
Slide 9: This slide includes Other Prime Cost including Opening and Closing Stock of Material.
Slide 10: This slide displays Table of Contents.
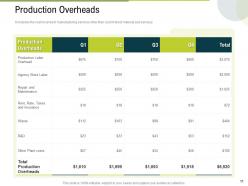
Slide 11: This slide represents Production Overheads.
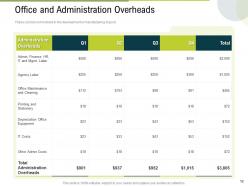
Slide 12: This slide showcases Office and Administration Overheads.
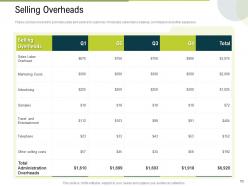
Slide 13: This slide presents Selling Overheads
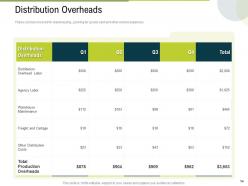
Slide 14: This slide showcases Distribution Overheads.
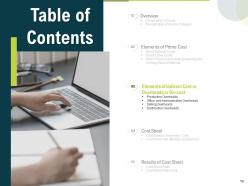
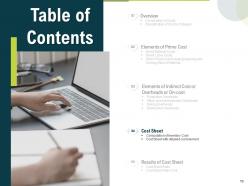
Slide 15: This slide displays Table of Contents of the presentation.
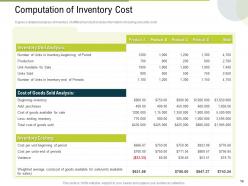
Slide 16: This slide explains Computation of Inventory Cost
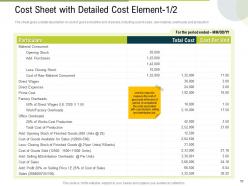
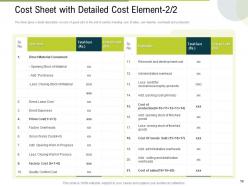
Slide 17: This slide showcases Cost Sheet with Detailed Cost Element.
Slide 18: The sheet in the slide gives a detail description on cost of good sold at the end of period, including cost of sales, raw material, overheads and production
Slide 19: This slide displays Table of Contents
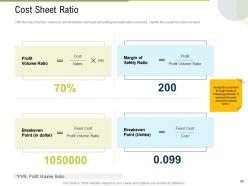
Slide 20: This slide represents Cost Sheet Ratio.
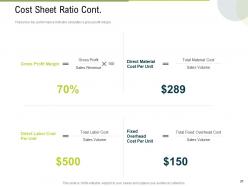
Slide 21: This slide is continued with Cost Sheet Ratio.
Slide 22: This is Icons Slide for Component of Costs.
Slide 23: This slide is titled as Additional Slides for moving forward.
Slide 24: This slide displays Mission, Vision and Goals.
Slide 25: This is About us slide to showcase company specifications.
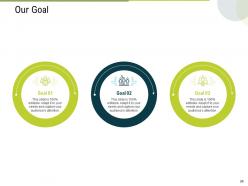
Slide 26: This slide displays Goals.
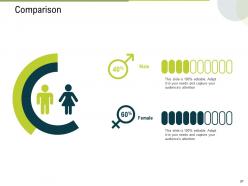
Slide 27: This slide shows Comparison between Male and female users.
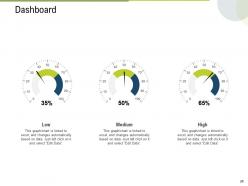
Slide 28: This slide shows Dashboard process.
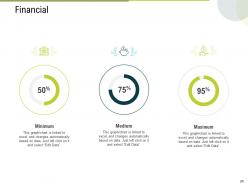
Slide 29: This is Financial slide.
Slide 30: This slide displays Quotes.
Slide 31: This slide shows Puzzle process.
Slide 32: This slide depicts Targets.
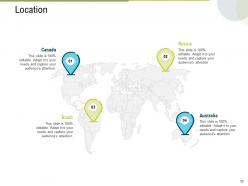
Slide 33: This slide showcases Location.
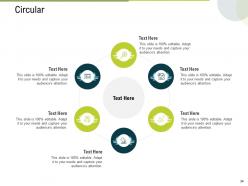
Slide 34: This slide shows Circular process.
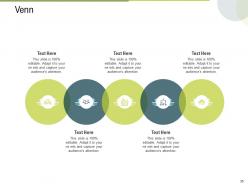
Slide 35: This slide depicts Venn diagram.
Slide 36: This slide displays Mind Map process.
Slide 37: This slide depicts Silhouettes
Slide 38: This slide displays Magnifying Glass.
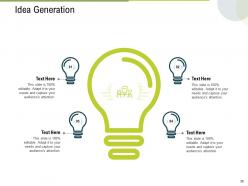
Slide 39: This slide shows Idea Generation
Slide 40: This is Thank you slide with contact details.
Production Cost Composition Powerpoint Presentation Slides with all 40 slides:
Use our Production Cost Composition Powerpoint Presentation Slides to effectively help you save your valuable time. They are readymade to fit into any presentation structure.









FAQs for Production Cost Composition
Production costs in manufacturing include raw materials, direct labor, overhead expenses, utilities, equipment maintenance, and quality control measures. These components work together to determine total manufacturing expenses, with companies across industries like automotive, electronics, and consumer goods finding that effective cost management in each area streamlines operations, reduces waste, and ultimately delivers improved profit margins and competitive pricing advantages.
Fixed costs remain constant regardless of production volume, including rent, salaries, insurance, equipment depreciation, and administrative expenses, while variable costs fluctuate directly with output levels through materials, labor hours, utilities, and packaging. Manufacturing companies find that understanding this distinction enables better pricing strategies, break-even analysis, and capacity planning, ultimately delivering improved cost control and competitive advantage in scaling operations.
Direct materials typically represent the largest component of production cost composition, often accounting for 40-60% of total manufacturing costs depending on the industry and product complexity. These raw materials, components, and supplies directly impact profitability through pricing fluctuations, supplier relationships, and inventory management, with manufacturing organizations increasingly finding that strategic sourcing and materials optimization deliver significant competitive advantages and operational efficiency.
Labor costs significantly influence pricing strategy by directly affecting profit margins, competitive positioning, and market accessibility through cost-plus pricing models, value-based adjustments, and strategic cost allocation decisions. Companies across manufacturing, retail, and service industries leverage automation, outsourcing, and efficiency improvements to optimize labor expenses, ultimately enabling more competitive pricing while maintaining profitability and market share.
Economies of scale significantly reduce per-unit production costs by spreading fixed expenses across larger output volumes, enabling bulk purchasing discounts, and optimizing resource allocation. Manufacturing companies, retail chains, and technology firms leverage these efficiencies to achieve 20-40% cost reductions, ultimately delivering competitive pricing advantages and enhanced profit margins in increasingly cost-conscious markets.
Overhead costs significantly impact production calculations by adding indirect expenses like facility rent, utilities, administrative salaries, and equipment maintenance to direct material and labor costs. These costs, typically allocated across products through activity-based costing or predetermined rates, can represent 30-50% of total production costs in manufacturing environments, ultimately determining pricing strategies, profit margins, and competitive positioning for businesses.
Companies can use activity-based costing, predetermined overhead rates, process costing, and cost driver analysis to accurately allocate indirect costs to production. These methods enhance cost transparency by distributing expenses like utilities, maintenance, and administrative overhead based on actual resource consumption, ultimately delivering more precise product pricing and improved profit margins across manufacturing operations.
Supply chain disruptions can significantly alter production cost structures by increasing raw material expenses, forcing alternative sourcing at premium prices, elevating logistics and transportation costs, and creating inventory holding pressures. These disruptions compel manufacturers across sectors like automotive and electronics to diversify suppliers, invest in buffer stock, and redesign operations, ultimately reshaping cost allocation strategies while building supply chain resilience.
Technology investment reduces long-term production costs by automating manual processes, optimizing resource allocation, and minimizing waste through predictive analytics and smart manufacturing systems. While initial capital requirements can be substantial, organizations across manufacturing, logistics, and energy sectors increasingly find that strategic technology adoption delivers significant operational efficiency, reduced labor costs, and enhanced competitive advantage.
Production waste management approaches include lean manufacturing principles, Six Sigma methodologies, just-in-time inventory systems, circular economy practices, and advanced analytics for process optimization. Through these strategic combinations, manufacturers streamline operations by reducing material excess, improving quality control, and enhancing resource allocation, with many organizations finding that systematic waste reduction delivers significant cost savings and competitive advantage.
Geographical location significantly influences production costs through labor expenses, raw material availability, transportation infrastructure, and regulatory compliance requirements. Companies in regions with lower wages, abundant resources, and efficient logistics networks achieve substantial cost advantages, while those in remote areas face higher shipping expenses and supply chain complexities, ultimately affecting competitive positioning and market pricing strategies.
**INPUT**: What is the relationship between production volume and cost per unit? **OUTPUT**: Production volume and cost per unit typically have an inverse relationship, where higher volumes spread fixed costs across more units, significantly reducing per-unit expenses. This economy of scale enables manufacturers in automotive, electronics, and consumer goods industries to achieve competitive pricing while maintaining margins, with many organizations finding that strategic volume planning ultimately delivers both operational efficiency and market advantage. [Word count: 60]
Alternative energy sources impact production cost efficiency by reducing long-term operational expenses, minimizing energy price volatility, and lowering maintenance costs compared to traditional fossil fuels. Manufacturing facilities, data centers, and processing plants increasingly find that solar, wind, and hydroelectric systems deliver predictable energy pricing, reduced carbon compliance costs, and enhanced operational reliability, ultimately providing sustainable competitive advantages.
**INPUT**: What strategies can be implemented to optimize production cost without compromising quality? **OUTPUT**: Cost optimization strategies include lean manufacturing, automation integration, supplier relationship management, waste reduction protocols, and strategic resource allocation. These approaches streamline operations by eliminating inefficiencies, negotiating better material rates, and implementing predictive maintenance, with many manufacturers finding that combining technology with process improvements ultimately delivers 15-30% cost reductions while enhancing product quality. [Word count: 54 words]
Competitor pricing significantly influences production cost strategy by driving efficiency improvements, technology investments, and supply chain optimization to maintain competitive margins. Companies often respond by streamlining operations, negotiating better supplier terms, and automating processes, with many manufacturers finding that strategic cost management ultimately delivers sustainable competitive advantage while preserving profitability in increasingly price-sensitive markets.
-
Perfect template with attractive color combination.
-
Designs have enough space to add content.
-
Understandable and informative presentation.
-
Nice and innovative design.