


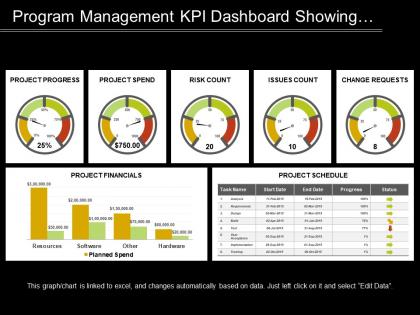
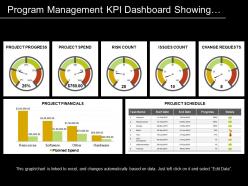
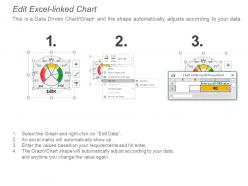
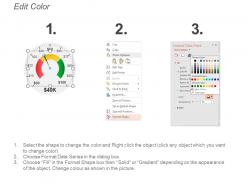
Program management kpi dashboard showing progress spend and risk count




Try Before you Buy Download Free Sample Product
 Impress Your
 Audience
 100%
100% Editable
 Save Hours
 of Time


Get folks to adopt good individual habits with our Program Management Kpi Dashboard Showing Progress Spend And Risk Count. Improve awareness of hygiene.
People who downloaded this PowerPoint presentation also viewed the following :
Program management kpi dashboard showing progress spend and risk count with all 6 slides:
Display the brilliant facets of your ideas. Our Program Management Kpi Dashboard Showing Progress Spend And Risk Count ensure they are called gems.
FAQs for Program management kpi dashboard showing progress spend
Honestly, start with the basics - schedule performance and budget variance. Those will tell you if you're hitting milestones and staying on track money-wise. Scope creep is a killer, so track that religiously. Resource utilization matters too - are your people actually doing what they should, or constantly fighting fires elsewhere? Stakeholder satisfaction scores help (though sometimes those surveys are kinda useless). Quality metrics depend on your program type. Risk mitigation and team velocity if you're doing iterative stuff. Don't go nuts with KPIs though - pick maybe 5-7 max. More than that just creates noise.
Look, first thing - get your boss on board with what actually matters to the business. Growth mode? Track revenue impact, not how many projects you finished. Map everything back to the big strategic stuff or you're wasting time. Honestly, this sounds simple but it's a total pain to execute. Break down those company goals into smaller pieces your programs can actually hit. Ask yourself "does this KPI make the CEO care?" If not, toss it. Oh and review quarterly - strategies change faster than you think. Pick metrics that actually move the needle.
Stakeholder satisfaction is huge - honestly one of your most critical KPIs. You can nail every technical milestone and stay under budget, but if your stakeholders hate the results? Your program's basically dead in the water. I found this out the painful way on a project that hit every target except the only one that actually mattered lol. Track it with regular surveys and feedback sessions throughout the whole lifecycle. Oh, and measure both sponsor satisfaction AND end-user satisfaction separately - they usually want completely different things. Trust me on that one.
So instead of updating spreadsheets manually every week (ugh), data analytics automates everything and gives you real-time dashboards. You'll catch problems way earlier - like your delivery rate tanking before it's a total mess. Predictive stuff helps you see what's coming next too, which honestly makes you look way smarter in meetings. The trick is connecting your project tools to one central platform automatically. Oh and start with maybe 3-4 KPIs that actually matter, then add more later. Don't go crazy right away.
Track your risk exposure percentage and how fast you're closing out mitigation plans. Also watch how long risks just sit there without anyone doing anything about them - that's usually where things go sideways. Most people miss this, but you should definitely compare what you thought would happen versus what actually happened when risks hit. Weekly velocity reports work well, then do monthly trends. Oh, and keep an eye on how many high-priority risks keep popping up. The whole point is staying ahead instead of just making lists that nobody reads.
Okay so basically project KPIs are all about the nitty-gritty stuff - staying on budget, hitting deadlines, getting deliverables done. Program KPIs? Way bigger picture. You're looking at ROI, whether stakeholders are actually happy, how multiple projects mesh together strategically. Projects deliver the thing. Programs deliver the change - if that makes sense? I always think of it like this: are you measuring "did we finish the task" or "did we actually move the business forward?" That's honestly the easiest way to figure out which metrics you should even care about.
Use dashboards and visual reports - they're way easier to digest than endless spreadsheets. For executives, stick to summaries that show trends and red flags. Project teams need the detailed stuff though. Traffic light colors (red/yellow/green) work great for quick status updates. Nobody wants to dig through raw data, so tell a story with your numbers instead. Monthly check-ins are perfect for explaining what's actually happening behind the metrics. Oh, and match your style to who you're talking to - what works for your boss definitely won't work for the dev team.
Honestly, you've gotta make KPI reviews a regular thing - quarterly works well for most people. Schedule actual sessions where you question if each metric still makes sense for your current goals. Markets shift, regulations change, tech evolves. Your KPIs from six months ago? They might be completely useless now. Don't wait until something breaks to review them either. That's where most teams mess up. External factors matter too - are your metrics reflecting what's actually happening in your industry? Start small next month. Pick your top 3 KPIs and really dig into whether they're driving the right behaviors.
So cost variance is just the gap between your planned budget and actual spending. Pretty straightforward stuff. When you're tracking it regularly, you'll catch problems early instead of getting blindsided later - and honestly, explaining budget overruns to executives is about as fun as it sounds. Short bursts work better than long tracking periods. Set up alert thresholds so you know when to investigate deeper. The real value is spotting patterns before they turn into disasters. Course corrections are way easier when you're not already three months behind and bleeding money.
Track stakeholder satisfaction and team morale - those soft metrics tell you why your hard numbers look good or terrible. I've watched programs nail every deadline while completely torching their teams. Not gonna last long, right? Monthly stakeholder sentiment surveys work great, plus bi-weekly team pulse checks give you a solid baseline. Also look at how well you're handling dependencies between workstreams and your change management game. Risk mitigation quality matters too, but honestly the stakeholder feedback and team health surveys are where you'll find gold.
So basically, pick your 5-10 most important milestones first - don't try to track everything at once, you'll go crazy. Track completion rates and how often stuff gets delayed. Honestly, I think milestone KPIs beat those vague "30% complete" updates any day since they're actual real things getting done. Set up a simple dashboard showing what percentage hit on time, average delays when they don't, and trends over a few months. Also watch for dependencies between milestones - that's where you'll catch bottlenecks before they wreck your timeline. Just make sure your milestones aren't random calendar dates but actual meaningful checkpoints.
Getting everyone to agree on what metrics matter is honestly the hardest part. Data quality is usually a mess too, especially when your systems barely talk to each other. Oh and don't even get me started on teams that try measuring literally everything - I've watched people get completely lost in their own dashboards! Setting realistic targets without historical data to work from? Good luck with that one. Start with maybe 3-5 metrics that actually move the needle. Get those dialed in first, then slowly add more as you figure out what you're doing.
Honestly, benchmarking is what stops you from flying blind with your KPIs. Like, you might think 85% completion rate sounds pretty good, but what if everyone else is hitting 95%? Suddenly you're behind. Compare yourself to industry standards, similar programs, or even just your past performance - otherwise you're just collecting random numbers. It helps you figure out realistic goals and spot where you're actually sucking. I'd grab 3-5 comparable programs or industry reports to stack up against. Then tweak your targets based on what you find.
For basic KPI stuff, try Microsoft Project, Smartsheet, or Asana - they're solid for timelines and budgets. Excel honestly works fine too if your team isn't huge. Power BI or Tableau are great if you need those fancy real-time dashboards that executives love staring at. Monday.com and Clarity PPM handle bigger programs well. My advice? Don't overthink it. Pick whatever your team will actually use every day instead of fighting with some complicated system they'll abandon after two weeks. I've seen too many projects fail because people chose the coolest tool instead of the practical one.
Start with the metrics that actually matter to your stakeholders - don't try tracking everything at once. I made that mistake before and it's a nightmare. Pick 3-5 solid ones covering scope, schedule, budget, and quality. The whole point is catching problems early enough to fix them, right? Resource constraints mean you gotta be smart about this. Go for the KPIs that either prevent disasters or show clear value to the bosses. You can always add more tracking later when things aren't so crazy, but honestly the core ones usually tell you what you need to know anyway.
-
The Designed Graphic are very professional and classic.
-
Great experience, I would definitely use your services further.