


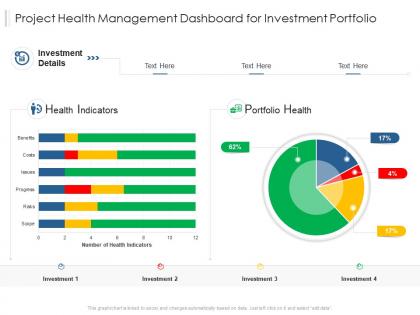
Project health management dashboard for investment portfolio




Try Before you Buy Download Free Sample Product
 Impress Your
 Audience
 100%
100% Editable
 Save Hours
 of Time


Our Project Health Management Dashboard For Investment Portfolio are topically designed to provide an attractive backdrop to any subject. Use them to look like a presentation pro.
People who downloaded this PowerPoint presentation also viewed the following :
Project health management dashboard for investment portfolio with all 2 slides:
Use our Project Health Management Dashboard For Investment Portfolio to effectively help you save your valuable time. They are readymade to fit into any presentation structure.

FAQs for Project health management dashboard
Essential components include real-time asset allocation displays, performance metrics tracking, risk assessment indicators, diversification analytics, and cost analysis tools. These elements streamline portfolio management by providing comprehensive visibility into holdings, enabling data-driven rebalancing decisions, and monitoring risk exposure, with many financial advisors finding that integrated dashboards ultimately enhance client communication and investment outcomes.
An investment portfolio dashboard enhances decision-making by providing real-time performance tracking, risk assessment metrics, asset allocation visualization, and comparative benchmarking tools. These features streamline analysis by consolidating data from multiple sources, enabling quick identification of underperforming assets, and facilitating strategic rebalancing decisions, ultimately delivering improved portfolio optimization and faster response to market changes.
Investment portfolio dashboards should visualize asset allocation percentages, total returns, risk metrics like volatility and beta, diversification ratios, and performance benchmarking against market indices. These comprehensive metrics enable portfolio managers and investors to identify underperforming assets, optimize risk-return ratios, and make strategic rebalancing decisions, with many financial institutions finding that real-time visualization ultimately delivers enhanced investment outcomes and competitive advantage.
Investors can customize dashboards by selecting relevant metrics like risk tolerance levels, asset allocation percentages, sector concentrations, performance benchmarks, and time horizon tracking. Through configurable widgets and personalized alerts, portfolio managers streamline monitoring by highlighting dividend yields, ESG scores, and volatility measures, ultimately enabling data-driven decisions that align with individual financial goals and investment strategies.
**INPUT**: What tools or software are best suited for creating an investment portfolio dashboard? **OUTPUT**: Best tools for investment portfolio dashboards include Tableau, Power BI, Excel with advanced features, specialized platforms like PortfolioVisualizer, and programming solutions using Python or R. These platforms streamline data integration, automate performance tracking, and deliver real-time analytics, with many financial advisors and institutional investors finding that comprehensive dashboards enhance client communications while enabling faster, more informed investment decisions.
Real-time data integration enhances investment portfolio dashboards by providing instant market updates, accurate asset valuations, and immediate risk assessments, enabling faster decision-making and portfolio adjustments. This technology streamlines performance tracking, automates rebalancing alerts, and delivers comprehensive market insights, with many financial advisors and institutional investors finding that real-time capabilities significantly improve client service and competitive advantage.
Asset allocation serves as the foundational framework for portfolio visualization, determining how investments are distributed across stocks, bonds, real estate, commodities, and alternative assets. Through strategic allocation displays, investors can quickly assess risk exposure, diversification levels, and performance balance across different asset classes, while financial advisors leverage these visual tools to demonstrate portfolio health and optimize investment strategies for better long-term returns.
Investors can track benchmark performance through portfolio dashboards that display real-time comparisons, percentage variance calculations, rolling return analyses, and risk-adjusted metrics like alpha and beta. These platforms enable portfolio managers and institutional investors to identify underperforming assets, rebalance allocations strategically, and demonstrate value to stakeholders, ultimately delivering enhanced transparency and more informed investment decisions.
Best practices for designing user-friendly investment portfolio dashboards include intuitive navigation, customizable widgets, real-time data visualization, clear performance metrics, and mobile responsiveness. These features streamline decision-making by presenting complex financial data through interactive charts, personalized alerts, and consolidated views, with many financial advisors finding that well-designed dashboards enhance client engagement and portfolio management efficiency.
Risk assessment can be effectively displayed through visual risk meters, heat maps showing asset volatility, correlation matrices, and VaR calculations with clear color coding. These dashboard elements enable portfolio managers and financial advisors to quickly identify exposure levels, diversification gaps, and potential vulnerabilities, while delivering real-time risk insights that support strategic rebalancing decisions and ultimately enhance investment outcomes.
Historical data trends in portfolio dashboards provide insights into asset performance patterns, market cycle behaviors, volatility measurements, correlation relationships, and risk-adjusted returns over different time periods. These trends enable investors to identify seasonal patterns, assess long-term growth trajectories, and make informed allocation decisions, with many financial advisors finding that historical context significantly enhances strategic planning and client communication.
Tax considerations significantly shape investment portfolio dashboard structure by requiring dedicated sections for tax-loss harvesting opportunities, asset location optimization across account types, and real-time capital gains tracking. These dashboards integrate tax-efficient rebalancing alerts, withholding tax calculations for international holdings, and harvest timing recommendations, with many financial advisors finding that tax-aware visualizations ultimately enhance after-tax returns and client decision-making.
Dashboards enable portfolio rebalancing by providing real-time asset allocation visualizations, automated deviation alerts from target weightings, and integrated rebalancing calculators that suggest specific buy-sell actions. Financial advisors and institutional investors use these tools to streamline rebalancing decisions, minimize transaction costs, and maintain optimal risk-return profiles, ultimately delivering more disciplined investment management and enhanced portfolio performance.
Behavioral finance principles enhance investment dashboard usability by addressing cognitive biases through visual design, reducing information overload with prioritized data displays, and incorporating nudges that encourage long-term thinking over emotional reactions. These approaches streamline decision-making by leveraging loss aversion psychology, confirmation bias mitigation, and anchoring adjustments, ultimately delivering more rational investment behaviors and improved portfolio outcomes.
Common pitfalls include over-relying on short-term performance metrics, misinterpreting correlation data, ignoring risk-adjusted returns, focusing solely on individual asset performance rather than portfolio balance, and neglecting benchmark comparisons. These interpretation errors often lead to reactionary investment decisions, with many financial advisors finding that comprehensive dashboard training and systematic analysis frameworks help investors maintain strategic perspective, ultimately delivering more consistent long-term returns and reduced emotional trading.
-
Great quality slides in rapid time.
-
Wonderful templates design to use in business meetings.
-
Visually stunning presentation, love the content.
-
Awesomely designed templates, Easy to understand.
-
Excellent work done on template design and graphics.