


Project management dashboard snapshot ppt inspiration ideas





Try Before you Buy Download Free Sample Product
 Impress Your
 Audience
 100%
100% Editable
 Save Hours
 of Time


Our Project Management Dashboard Ppt Inspiration Ideas get everyone to act as a group. It encourages the creation of consensus.
People who downloaded this PowerPoint presentation also viewed the following :
Content of this Powerpoint Presentation
Description:
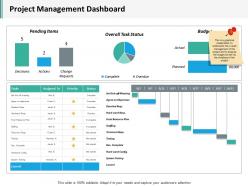
The image showcases a "Project Management Dashboard" PowerPoint slide, designed to provide an at-a-glance overview of a project's status across various parameters:
1. Pending Items:
Quantifies the number of decisions, actions, and change requests that are pending.
2. Overall Task Status:
A pie chart displays the proportion of tasks that are complete versus overdue.
3. Budget:
A bar graph compares the actual spend against planned budget, with a note emphasizing the importance of this metric.
4. Task Timeline:
A Gantt chart lists tasks, their assignment, priority, status, and a timeline from September 2nd to October 12th.
Use Cases:
This type of dashboard is useful for project managers to communicate key project metrics to stakeholders and team members. It can be adapted for use across different industries:
1. Technology Development:
Use: Tracking software development milestones.
Presenter: IT Project Manager.
Audience: Development Team, Stakeholders.
2. Construction and Engineering:
Use: Monitoring construction project progress.
Presenter: Construction Manager.
Audience: Contractors, Clients.
3. Healthcare Administration:
Use: Managing healthcare projects, like hospital renovations or system upgrades.
Presenter: Healthcare Project Coordinator.
Audience: Hospital Administrators, Medical Staff.
4. Educational Institutions:
Use: Overseeing campus improvement projects.
Presenter: Dean or Educational Project Manager.
Audience: Faculty, Administration.
5. Financial Services:
Use: Implementation of new financial systems or services.
Presenter: Finance Project Lead.
Audience: Finance Team, Regulatory Bodies.
6. Marketing and Advertising:
Use: Planning and executing marketing campaigns.
Presenter: Marketing Manager.
Audience: Marketing Team, Advertisers.
7. Retail and Supply Chain Management:
Use: Overseeing product launch timelines and supply chain optimizations.
Presenter: Supply Chain Manager.
Audience: Suppliers, Retail Managers.
Project management dashboard snapshot ppt inspiration ideas with all 5 slides:
Our Project Management Dashboard Ppt Inspiration Ideas will cleanse the air. They will enhance the purity of your thoughts.
FAQs for Project management dashboard snapshot
Essential KPIs for project management dashboards include schedule variance, budget variance, resource utilization, milestone completion rates, and risk indicators. These metrics enable project managers to track progress, identify bottlenecks, and make data-driven decisions, with many organizations finding that comprehensive dashboard monitoring delivers improved project success rates and enhanced stakeholder communication.
Visual elements like charts, graphs, progress bars, milestone timelines, and heat maps transform complex project data into instantly comprehensible insights, enabling stakeholders to quickly identify bottlenecks, resource allocation issues, and timeline deviations. These visual representations streamline decision-making by presenting real-time status updates, budget tracking, and team performance metrics in digestible formats, with many project managers finding that visual dashboards reduce reporting time while enhancing stakeholder engagement and accountability.
**INPUT**: What are the best practices for organizing information on a project management dashboard to ensure clarity and usability? **OUTPUT**: Best practices include prioritizing critical metrics at the top, grouping related information into logical sections, using consistent visual hierarchies, implementing color coding for status indicators, and maintaining white space for readability. These approaches streamline decision-making by reducing cognitive load, enabling faster data interpretation, and enhancing team collaboration, with many organizations finding that well-organized dashboards ultimately deliver improved project visibility and accelerated delivery timelines.
Real-time data integration enhances project management dashboards by providing instant visibility into project status, resource allocation, and potential bottlenecks, enabling managers to make informed decisions quickly. This streamlines workflow optimization, minimizes delays, and improves team coordination, with many organizations finding that real-time insights ultimately deliver faster project completion and enhanced operational efficiency.
Common mistakes include overcrowding with excessive metrics, poor visual hierarchy, ignoring user-specific needs, inconsistent data sources, and lack of real-time updates. Many organizations find that cluttered dashboards with irrelevant KPIs confuse rather than clarify, while successful implementations focus on essential metrics, intuitive navigation, and role-based customization, ultimately delivering clearer insights and faster decision-making.
Stakeholder needs directly influence dashboard design by determining key metrics, visualization formats, access levels, and reporting frequencies based on their specific roles and responsibilities. Executives typically require high-level progress summaries and budget overviews, while project managers need detailed task tracking and resource allocation views, and team members focus on individual assignments and deadlines, ultimately delivering targeted insights that enhance decision-making across organizational levels.
Color psychology influences project management dashboard effectiveness by guiding user attention, conveying status information intuitively, and reducing cognitive load during decision-making processes. Strategic color choices enhance user experience through consistent status indicators like red for urgent tasks and green for completed milestones, while maintaining visual hierarchy that streamlines workflow management and ultimately delivers faster project insights across teams.
A dashboard facilitates communication and collaboration by providing real-time project visibility, centralized task tracking, shared progress updates, and transparent resource allocation across all team members. Through unified data access, teams streamline decision-making, reduce email chains, and maintain alignment on priorities, with many organizations finding that dashboard transparency enhances accountability and accelerates project delivery timelines.
**INPUT**: What tools and software are most effective for creating customizable project management dashboards? **OUTPUT**: Effective tools for customizable project management dashboards include Microsoft Project, Asana, Trello, Monday.com, and Smartsheet, each offering robust visualization capabilities. These platforms streamline project oversight by enabling real-time tracking, automated reporting, and personalized metrics display, with many organizations finding that customizable dashboards enhance team collaboration and accelerate decision-making processes. [Word count: 54 words]
A project management dashboard helps identify potential project risks early by tracking key performance indicators, monitoring budget variances, displaying timeline deviations, and highlighting resource allocation issues in real-time. Through automated alerts and visual data representation, project managers can quickly spot bottlenecks, budget overruns, and schedule delays, ultimately enabling proactive risk mitigation and improved project outcomes.
Mobile-optimized project management dashboards enhance remote team productivity by enabling real-time project tracking, seamless communication, and instant status updates from any location. These platforms streamline workflow management through push notifications, offline access, and touch-friendly interfaces, with many distributed teams finding that mobile accessibility reduces response times and improves collaboration across different time zones, ultimately delivering greater operational efficiency.
User feedback can be incorporated through regular surveys, usability testing sessions, feature request tracking, stakeholder interviews, and analytics monitoring of dashboard usage patterns. These methods enable development teams to identify pain points, prioritize enhancements, and validate design changes, with many organizations finding that continuous feedback loops ultimately deliver more intuitive interfaces and improved project outcomes.
**INPUT**: What data visualization techniques are most effective for project status reporting in a dashboard? **OUTPUT**: Effective project status visualization techniques include Gantt charts, milestone timelines, progress bars, RAG (Red-Amber-Green) status indicators, and burndown charts. These visualizations streamline project oversight by displaying task dependencies, resource allocation, and timeline adherence at a glance, with many project managers finding that combined visual elements enhance stakeholder communication and accelerate decision-making processes. [Word count: 54]
The choice of metrics fundamentally shapes strategic decisions by determining what information leaders prioritize, analyze, and act upon when evaluating project performance and resource allocation. Strategic metrics like ROI, customer satisfaction, and market timing drive long-term planning, while operational metrics such as task completion rates guide immediate tactical adjustments, with many organizations finding that balanced scorecards combining both perspectives enable more comprehensive decision-making and competitive advantage.
Project management dashboards support agile methodologies by providing real-time sprint tracking, burndown charts, velocity metrics, backlog visualization, and team performance indicators. These tools enable continuous improvement through automated retrospective data collection, cycle time analysis, and bottleneck identification, with many development teams finding that enhanced visibility accelerates delivery cycles and improves stakeholder collaboration.
No Reviews