


Project portfolio status budget dashboards




Try Before you Buy Download Free Sample Product
 Impress Your
 Audience
 100%
100% Editable
 Save Hours
 of Time


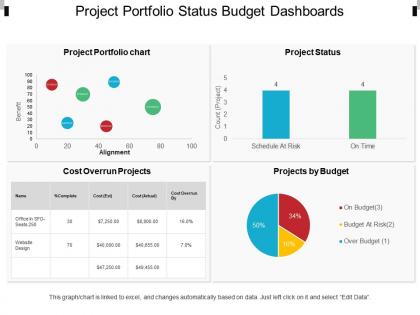
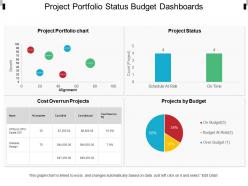
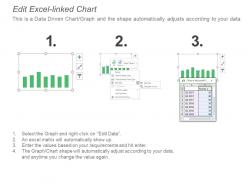
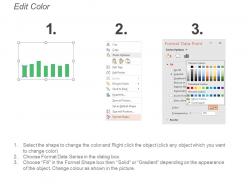
Our, project portfolio status cost and performance dashboards unique PowerPoint design for presenting your improved finance growth ideas. We have shown a four-stage process here, displaying the concept of the project portfolio, and project management. Developing a great reputation for being the driving energy of a good presentation, we have displayed the graphics of performance indicators, bar graphs, and charts for a precise comparison between various figures. See them give the petitioned impulse to your team. We design great PPT infographics retreated by colorful icons that integrate into a wonderfully knit PowerPoint design template. Grow great name and fame using our project portfolio status cost and performance dashboards unique PowerPoint layout. Our Project Portfolio Status Budget Dashboards get across your genuine concern. They ensure your advice is appreciated.
People who downloaded this PowerPoint presentation also viewed the following :
Project portfolio status budget dashboards with all 6 slides:
Achieve excellent group dynamics with our Project Portfolio Status Budget Dashboards. They enhance the development of great harmony.
FAQs for Project portfolio
Key components include project status indicators, resource allocation views, budget tracking, timeline visualizations, risk assessments, and ROI metrics. These elements streamline decision-making by providing real-time visibility into portfolio performance, enabling executives to quickly identify bottlenecks, reallocate resources strategically, and prioritize high-impact initiatives, ultimately delivering improved project outcomes and competitive advantage.
Data visualization transforms complex project portfolio metrics into clear, actionable insights by presenting KPIs, timelines, resource allocation, and risk indicators through interactive charts, heat maps, and real-time dashboards. These visual tools enable portfolio managers to quickly identify underperforming projects, resource bottlenecks, and strategic alignment issues, ultimately delivering faster decision-making and improved portfolio outcomes across organizations.
Critical portfolio health metrics include project progress against milestones, resource utilization rates, budget variance, risk exposure levels, and strategic alignment scores. These metrics enable portfolio managers to identify underperforming initiatives, optimize resource allocation, and ensure strategic objectives are met, with many organizations finding that balanced scorecards combining financial and operational indicators deliver the most comprehensive portfolio oversight.
Stakeholders can effectively monitor project progress through real-time dashboards by tracking key performance indicators, milestone completion rates, budget utilization, resource allocation, and risk status updates. These interactive platforms enable executives, project managers, and team members to identify bottlenecks quickly, make data-driven decisions, and maintain alignment across departments, ultimately delivering enhanced project visibility and improved strategic outcomes.
**INPUT**: What tools or software are recommended for creating project portfolio management dashboards? **OUTPUT**: Recommended tools for project portfolio management dashboards include Microsoft Project Online, Smartsheet, Tableau, Power BI, and Monday.com, each offering unique visualization and tracking capabilities. These platforms streamline portfolio oversight by consolidating project data, automating status reporting, and enabling real-time resource allocation decisions, with many organizations finding that integrated dashboards ultimately deliver enhanced strategic visibility and improved project outcomes.
Integrating financial data into dashboards revolutionizes project prioritization by providing real-time visibility into budget performance, ROI projections, and resource allocation costs. Through automated financial tracking, organizations can quickly identify high-value initiatives, reallocate funds from underperforming projects, and make data-driven decisions that maximize portfolio value, ultimately delivering stronger returns and strategic alignment.
Dashboards support portfolio risk management by providing real-time risk visualization, automated alert systems, cross-project dependency mapping, and predictive analytics for early warning signals. Through integrated monitoring tools, organizations can quickly identify emerging threats, assess cumulative portfolio exposure, and implement proactive mitigation strategies, ultimately enabling faster decision-making and reduced project failures across their entire portfolio.
Customizable dashboards enable different stakeholders to access relevant project portfolio information tailored to their specific roles, responsibilities, and decision-making needs through personalized views, metrics, and reporting levels. Executives can focus on strategic KPIs and portfolio-wide performance, while project managers dive into operational details and resource allocation, ultimately delivering enhanced transparency and more informed decision-making across organizational hierarchies.
Predictive analytics can be incorporated through automated forecasting models, risk prediction algorithms, resource demand forecasting, budget variance predictions, and timeline optimization tools. These capabilities enable organizations to anticipate project bottlenecks, optimize resource allocation, and proactively address potential delays, with many enterprises finding that predictive insights ultimately deliver improved portfolio success rates and strategic decision-making.
Best practices for maintaining data accuracy and consistency in dashboards include establishing standardized data sources, implementing automated data validation rules, creating regular audit schedules, defining clear data governance protocols, and setting up real-time monitoring alerts. These approaches streamline data integrity by minimizing manual errors, ensuring consistent reporting metrics, and enabling rapid identification of discrepancies, with many organizations finding that automated validation significantly reduces project delays and enhances stakeholder confidence.
Project portfolio management dashboards facilitate communication by providing centralized visibility into project status, resource allocation, timeline updates, and performance metrics across all teams. Through real-time data sharing and standardized reporting formats, organizations streamline information flow, reduce miscommunication, and enable faster decision-making, with many finding that enhanced transparency ultimately delivers improved collaboration and strategic alignment.
Effective scenario planning dashboards should include resource allocation simulators, timeline modeling tools, budget variance calculators, risk impact assessments, and capacity planning modules. These features enable portfolio managers to test different project combinations, evaluate resource constraints across multiple scenarios, and compare potential outcomes, with many organizations finding that integrated forecasting capabilities ultimately deliver more strategic decision-making and competitive advantage.
Historical data insights enhance strategic alignment by revealing performance patterns, resource utilization trends, success factors, and portfolio optimization opportunities that inform future decision-making. Through predictive analytics and trend analysis, organizations can better allocate resources, prioritize high-impact projects, and adjust strategic direction, with many companies finding that data-driven portfolio management delivers improved ROI and competitive advantage.
Common challenges include data integration across multiple systems, ensuring real-time accuracy, securing stakeholder buy-in, and managing complex customization requirements. While these obstacles can initially slow implementation, organizations in sectors like manufacturing and financial services find that addressing data quality and user training upfront ultimately delivers enhanced visibility, streamlined decision-making, and improved portfolio performance.
User feedback significantly influences dashboard design by identifying usability gaps, prioritizing essential features, and revealing workflow preferences that enhance interface layouts and data visualization choices. Through iterative feedback cycles, organizations streamline navigation, customize reporting capabilities, and optimize real-time analytics, with many project teams finding that user-driven design improvements ultimately deliver faster decision-making and improved project outcomes.
No Reviews