


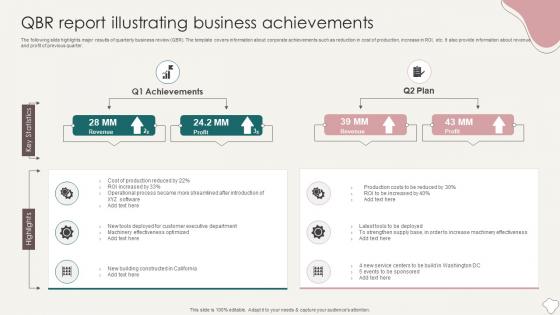
QBR Report Illustrating Business Achievements




Try Before you Buy Download Free Sample Product
 Impress Your
 Audience
 100%
100% Editable
 Save Hours
 of Time


The following slide highlights major results of quarterly business review QBR. The template covers information about corporate achievements such as reduction in cost of production, increase in ROI, etc. It also provide information about revenue and profit of previous quarter.
People who downloaded this PowerPoint presentation also viewed the following :
QBR Report Illustrating Business Achievements with all 6 slides:
Use our QBR Report Illustrating Business Achievements to effectively help you save your valuable time. They are readymade to fit into any presentation structure.





FAQs for QBR Report
Honestly, most QBRs are just chart dumps that put everyone to sleep. You need four things: how you did against quarterly goals, your biggest wins and fails, what you're forecasting next, and actual action items with names attached. The story matters way more than perfect slides - executives want to know the "why" behind your numbers, not just see a bunch of graphs. Oh, and definitely do a one-slide summary upfront. Leadership will scan that first anyway before deciding if they care about the details.
Honestly, templates are a game-changer for QBRs. Your stakeholders won't have to wade through walls of text anymore - just clean sections with headers, bullets, and actual breathing room. People get used to finding the same metrics in the same spots each quarter, which is weirdly satisfying. The format forces you to cut the fluff too since you've got limited space. Oh, and don't go crazy with variety - I'd stick to maybe 2-3 template styles tops. Your execs will love the predictable layout, trust me.
Honestly, lead with your wins and the numbers - execs want results first, context later. Use charts instead of bullet points because nobody reads walls of text anyway. I bombed a presentation once with like 40 slides and literally watched people check their phones. Pick 3-5 big themes max and don't sugarcoat the stuff that's not working - they'll ask anyway. Always connect back to ROI or they'll zone out. Oh, and wrap up with specific asks for next quarter. Be super clear about what resources you need because vague requests get ignored.
Quarterly makes the most sense - it's literally in the name, right? But honestly, it really depends on your situation. High-value clients or fast-growing accounts? Maybe go monthly. Stable relationships work fine with quarterly though. You'll want to think about contract cycles, budget planning, and how fast your numbers actually change. I'd say start quarterly and see what happens. No point burning everyone out with too many meetings if they're not actually useful for making decisions. Some clients love the frequent check-ins, others just want the essentials every few months.
Ugh, the worst thing you can do is dump every single metric on them - nobody wants that. I learned this the hard way lol. Pick maybe 3-5 things that actually move the needle for their business. Don't sugarcoat problems either, they'll see right through it. Context is huge too. Like if numbers dropped, explain WHY - was it seasonal? New competitor? Always tie it back to what they care about. Oh and definitely end with next steps so they know you're not just pointing out issues. Trust me, stakeholders love when you're real with them instead of trying to make everything sound perfect.
Honestly, analytics can turn your QBR from boring status updates into something that actually matters. You'll spot trends, predict which customers might churn, and figure out what's really driving revenue (not just what sounds impressive). I've seen too many meetings where people just say "everything's great!" without any real context. Benchmarking against industry data gives stakeholders something concrete to work with. Predictive modeling helps you see next quarter's problems coming. Just don't go overboard - pick 3-4 metrics that actually matter instead of drowning everyone in useless dashboards.
Look, stakeholder feedback is your roadmap for better QBRs next time around. They'll tell you which metrics actually matter and what format works best for them. Half the time they're not even reading certain sections - that's useful info right there. Some of my biggest wins came from random comments like "wait, what does this chart even mean?" Don't just rely on formal surveys either. Those quick hallway conversations after meetings? Gold. Use all of it to tweak your data choices and presentation flow. Focus on insights that'll actually move the needle for decisions.
Dude, just make a template after your next QBR while it's all still fresh. Seriously saves your ass when you're stressed about the next one. Set up your standard sections - executive summary, KPIs, wins, challenges, action items - then you just drop in new data each quarter. Your stakeholders will actually thank you because they'll know where everything is. I learned this the hard way after scrambling through like three chaotic QBRs in a row. Templates keep everything consistent too, which honestly makes you look way more organized than you probably are.
Honestly, pick like 5-7 key metrics and actually tell a story with them - don't just dump numbers everywhere. Revenue vs target is obvious, but also track customer health scores and churn rates. Those support ticket volumes? Super underrated - they'll show you problems before they explode. I always include customer satisfaction too since it predicts so much. Quarter-over-quarter comparisons make trends way more obvious than random snapshots. Product adoption metrics matter if you want to see what's actually working. Skip the spreadsheet approach - your stakeholders need context, not a data graveyard. Focus on what the numbers actually mean for business decisions.
Okay so here's the thing - tie everything back to those business goals you already hammered out with stakeholders. Don't just throw metrics at them. Start each section with "this is how we're getting closer to [whatever goal]" then show your proof. I used to mess this up constantly, just word-vomiting data everywhere. Your QBR should feel like you're giving them a roadmap update, not some random laundry list of stuff you did. The story matters way more than people think - frame it around revenue growth, customer retention, whatever you agreed on.
Kick things off with a poll or get people sharing their biggest pain points - gets everyone engaged from the start. Tell stories around your data instead of just throwing numbers at them. I usually toss in some "what if" scenarios to get their brains working strategically. Visuals beat text-heavy slides every time. Standing while you present actually keeps the energy up (weird but it works). Break for discussion every 10-15 minutes so you're not just talking at people. Oh, and ask "what questions do you have" instead of "any questions" - people respond way better to that phrasing for some reason.
For your QBR, pull together specific examples where teams actually worked together on stuff. Show the numbers - like how marketing and sales got on the same page about lead quality, or when product and engineering hit their deadlines together. Honestly, the "before and after" stories are what really grab people's attention. Make a whole section with concrete wins: projects you knocked out together, problems you solved as a group, shared metrics that actually moved up. Skip the activity lists though - focus on business impact. Oh, and grab quotes from other team leads about what clicked. Those always land well.
Dude, templates are seriously a game changer for QBRs. No more spending forever on formatting - just dump your data in and you're done. When everyone uses the same layout, execs can actually compare departments without getting confused by random slide designs. I learned this the hard way after watching my old boss scramble before a board meeting lol. Your stakeholders will love knowing exactly where to find the important stuff too. Just start basic: KPIs, wins, what went wrong, next quarter's plan. You can get fancy later, but honestly the simple version works great.
Honestly, ditch the email-and-Excel chaos for your QBRs. Platforms like Notion or Google Workspace let your team update metrics in real-time and comment directly on sections. No more version control nightmares. I've watched teams cut their prep time in half just by switching from PowerPoint ping-pong to shared dashboards. Pick one tool everyone will actually use - that's the tricky part tbh. Set clear owners for each section so nobody's stepping on toes. Try migrating your next QBR template to something collaborative. You'll be amazed how much smoother it goes.
Dude, interactive dashboards are everywhere now. Nobody wants to sit through static PowerPoint slides anymore - it's brutal. Companies are using Tableau or building custom web apps so people can actually click around and dig into the data during meetings. Storytelling helps too since raw numbers put everyone to sleep. Oh, and AI stuff is creeping into QBRs now. Instead of just "here's what happened," you're getting predictive insights about what might happen next. Pretty cool actually. You should try adding one interactive piece to your next QBR and see if people engage more.
-
No second thoughts when I’m looking for excellent templates. SlideTeam is definitely my go-to website for well-designed slides.
-
The best part about SlideTeam is their meticulously prepared presentations (complete-decks and single-slides both), infused with high-quality graphics and easy to edit. All-in-all worthy products.