Quarterly Project Budget Target Vs Achievement Report

Rating:
100%
Quarterly Project Budget Target Vs Achievement Report Quarterly Project Budget Target Vs Achievement Report
Slide 1 of 7

or

Favourites Favourites

Try Before you Buy Download Free Sample Product

Audience Impress Your
Audience
Editable 100%
Editable
Time Save Hours
of Time
The Biggest Sale is ending soon in
0
0
:
0
0
:
0
0
Rating:
100%
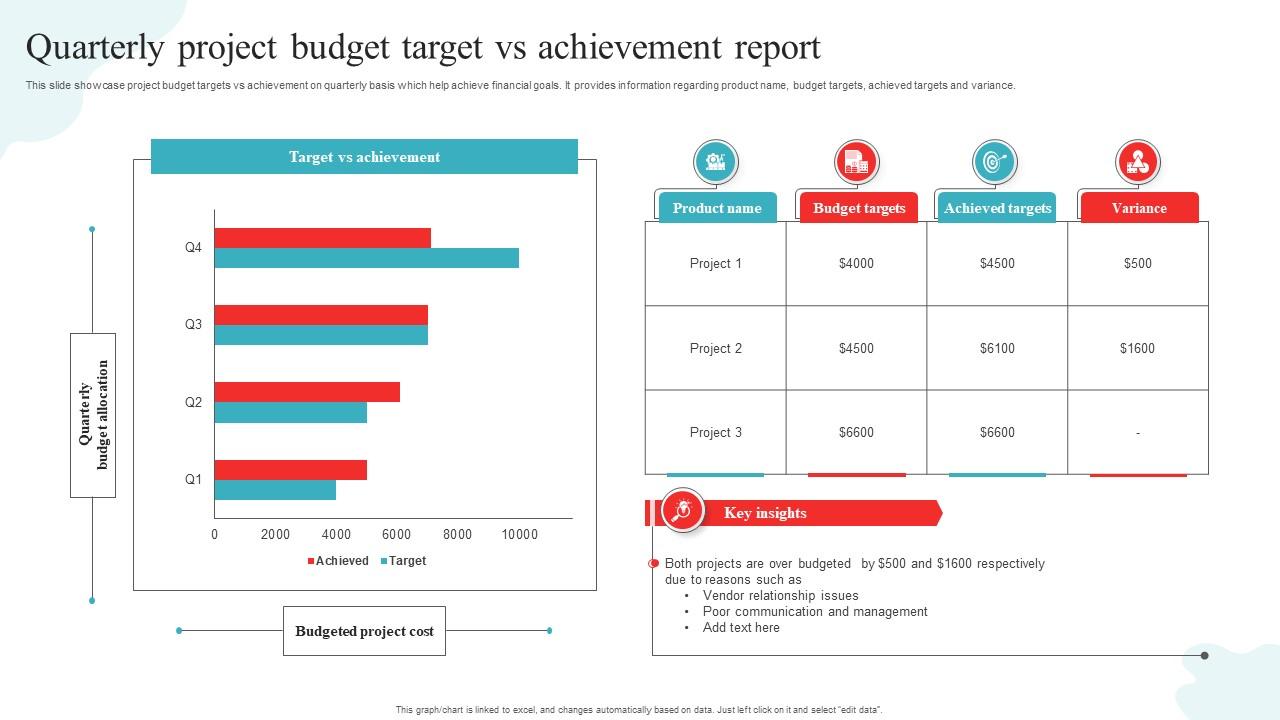
This slide showcase project budget targets vs achievement on quarterly basis which help achieve financial goals. It provides information regarding product name, budget targets, achieved targets and variance. Presenting our well structured Quarterly Project Budget Target Vs Achievement Report. The topics discussed in this slide are Target, Budget, Achievement. This is an instantly available PowerPoint presentation that can be edited conveniently. Download it right away and captivate your audience.

FAQs for Quarterly Project Budget Target

So you'll want to compare your actual numbers against what you budgeted - that's your variance analysis. Track trends over time too, and figure out what's eating up most of your costs. Revenue vs targets is obviously huge. Cash flow patterns matter more than people think, honestly. Seasonal stuff can mess with your head if you're not paying attention - learned that one the hard way! Also track ratios like expenses as a percentage of revenue. Start with your biggest variances since that's where you'll see the most impact. No point analyzing tiny differences when you've got major gaps elsewhere.

Dude, budget analysis is a game changer - it shows you exactly where your cash is going vs. where you thought it would go. You'll catch overspending before it gets ugly and see which departments are actually worth the investment. I swear, once you start doing monthly variance reports (sounds boring but trust me), you can pivot resources super fast when things change. The trick is checking actuals against your forecasts regularly, not just quarterly. It's honestly like having superpowers for making financial decisions. Plus strategic planning becomes so much easier when you have real data backing you up.

Honestly? Excel's probably all you need. I know it sounds basic but you can build solid models and run scenarios without getting fancy. Most people way overthink this stuff - I've watched teams spend forever evaluating expensive software when a good spreadsheet would've worked fine. If you're already using Microsoft stuff, Power BI's pretty decent for visualizations. Tableau's great too but costs more. Only go for the heavy-duty tools like Adaptive Insights if you're dealing with crazy complex multi-department budgets. My advice? Start simple, see where you actually run into problems, then upgrade from there.

Think of historical data as your cheat sheet for budgeting. Pull the last 2-3 years of actual spending versus what you planned - that variance analysis is gold. You'll see which departments always blow their budgets and catch those seasonal spikes nobody remembers until they hit. Without this stuff, you're basically throwing darts blindfolded. Look for patterns but don't assume they'll repeat exactly (learned that one the hard way). The spending trends and cyclical stuff will give you way better baselines than just guessing what sounds reasonable.

Look, forecasting is what makes budget analysis actually useful - you're predicting future revenue and expenses based on past data and market trends. Without it, you're just staring at random numbers. Use it to catch problems early, spot growth opportunities, and set realistic goals. Things move fast though, so update your forecasts constantly as new info comes in. Honestly, I'd start by checking how accurate your last quarter's forecast was - that'll show you exactly where your assumptions were off and need tweaking.

Honestly, the worst part is always messy data - different departments send stuff in random formats or just forget things entirely. Time crunch is brutal too since everyone wants results yesterday but hands you info at the last second. Historical data from multiple systems that don't sync? Total nightmare. Plus stakeholders love making wild assumptions about revenue being higher or costs being lower than reality. Oh, and I learned this the hard way - always make standardized templates from the start. Saves you so much headache later when things get crazy.

So variance analysis is basically comparing what you actually spent vs what you budgeted. Pretty straightforward stuff. You look at the differences and figure out why they happened - helps you spot trends and make smarter decisions next time. Like if you're always going over on groceries but under on gas, that tells you something about your spending habits. I always start with the biggest expenses first since that's where you'll see the most impact. It's kind of like doing detective work on your own money, which sounds weird but actually makes budgeting way less of a guessing game.

Start with variance analysis - just compare what you actually spent vs what you budgeted. That'll show you problem spots fast. Your burn rate is huge too since, you know, going broke isn't ideal. I'd also track revenue trends and cost per unit, especially if you're measuring profit by department or product. Weekly dashboard reviews work best for me. Don't waste time on vanity metrics though - honestly, half the stuff people track is useless. Stick to numbers that'll actually change how you make decisions.

You'll want everyone using the same template and timeframes - saves so much headache later. Finance coordinates obviously, but operations knows the real equipment costs. HR handles headcount stuff. Sales forecasts are make-or-break for revenue planning. Marketing will ask for the moon (they always do), but you actually need their pipeline numbers. Get actual spending data from each department first, then realistic projections. Weekly check-ins help tons instead of everyone panicking at the deadline. Oh and make sure cost categories match across departments - learned that one the hard way.

Skip the spreadsheet dump and tell a story with your numbers. Lead with the big takeaway - what actually happened to the budget? Charts are your friend here because nobody wants to scan endless rows of data. I'd focus on the variances that'll make execs sit up and pay attention. Always compare to last year or your benchmarks so people get context. One page executive summary, max. Oh, and don't just present problems - come with solutions and clear next steps. They're gonna ask "what now?" anyway, so beat them to it.

So basically you want to make a few different versions of your budget - best case, worst case, and realistic. Take your main budget and tweak the big stuff for each one. Revenue projections, major costs, whatever could actually swing either way. Then figure out which variables mess with your numbers the most (that's your sensitivity analysis). Honestly, it's like having Plan B, C, and D ready before things get messy. Way better than scrambling later when something unexpected hits. You'll end up with a range of possibilities instead of just crossing your fingers and hoping one projection works out.

Budget analysis is like a reality check for your big plans. Shows you what you can actually pull off versus what sounds good on paper. You'll be forced to pick which projects matter most when money gets tight. Honestly, it's saved my butt more times than I can count - helps you see cash flow problems coming before they hit. The ROI piece is huge too. You can figure out which strategies actually pay off and maybe push some stuff to next quarter. Run different scenarios throughout your planning, not just once at the end. Trust me on this one.

Honestly, stakeholder feedback is everything for budget analysis. You'll miss key priorities without it. Department heads and users catch stuff that spreadsheets can't - like when you think software looks cost-effective but it's actually garbage nobody wants to use. Getting their input early helps spot real risks and makes your projections way more accurate. Plus people buy into decisions more when they feel heard during the process. I learned this the hard way once. Loop them in before you wrap up your analysis or you might be starting over later.

Honestly, variance analysis is your best friend here - just compare what you actually spent vs what you budgeted. Percentage changes matter way more than raw dollar amounts, trust me on this one. Charts and graphs will save your sanity because nobody wants to stare at endless spreadsheet rows. When you spot big variances, dig into the "why" behind them. Break things down by time periods and categories too. Oh, and maybe grab some coffee first because this stuff can get pretty mind-numbing. The real value isn't in the numbers themselves - it's understanding what caused them so you can make smarter decisions next time.

Make your budget data super accessible - don't just show final numbers, break down your assumptions and where everything came from. People hate being left in the dark about this stuff. Keep everyone updated when things change (and they will change). I'd definitely hold review sessions where folks can grill you on the analysis - honestly saves you headaches later. Oh, and document your thinking process so people can actually follow your logic instead of wondering what you were smoking. Better to over-communicate than deal with confused stakeholders blowing up your inbox.

Ratings and Reviews

100% of 100
Review Form
Write a review
Most Relevant Reviews
  1. 100%

    by Clark Ruiz

    Qualitative and comprehensive slides.
  2. 100%

    by Dorsey Hudson

    SlideTeam is the best in the business. Their templates are engaging and customizable. You can rely on them.

2 Item(s)

per page: