


Quality control kpi dashboard showing test execution status





Try Before you Buy Download Free Sample Product
 Impress Your
 Audience
 100%
100% Editable
 Save Hours
 of Time


Acquire a greater influence with our Quality Control Kpi Dashboard Showing Test Execution Status. Establish control over the consequences.
People who downloaded this PowerPoint presentation also viewed the following :
Content of this Powerpoint Presentation
Description:
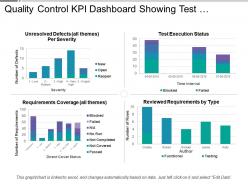
This image presents a Quality Control KPI Dashboard featuring visual data relevant to software testing and project management. It contains four different charts:
1. Unresolved Defects (all themes) Per Severity:
This bar chart categorizes defects by severity, ranging from 1-Low to 5-Urgent, and shows the number of defects in 'New', 'Open', and 'Reopen' statuses.
2. Test Execution Status:
This stacked bar chart highlights the testing progress over specific time intervals, displaying the count of 'Blocked' and 'Failed' test cases.
3. Requirements Coverage (all themes):
This chart breaks down the status of requirements coverage, indicating the count of requirements that are 'Blocked', 'Failed', 'N/A', 'No Run', 'Not Completed', 'Not Covered', and 'Passed'.
4. Reviewed Requirements by Type:
This final bar chart shows the number of 'Functional' and 'Testing' requirements reviewed by different authors, listed by their first names.
Use Cases:
Potential industries where this kind of dashboard could be applied:
1. Software Development:
Use: To monitor software quality and testing progress
Presenter: Quality Assurance Manager
Audience: Development team and product stakeholders
2. Information Technology Services:
Use: To evaluate IT service management and incident response
Presenter: IT Service Manager
Audience: IT service staff and management
3. Healthcare:
Use: To track patient care quality and compliance with health standards
Presenter: Healthcare Quality Analyst
Audience: Healthcare providers and administrative staff
4. Manufacturing:
Use: To ensure product quality control and manufacturing process optimization
Presenter: Quality Control Engineer
Audience: Plant managers and quality assurance teams
5. Automotive:
Use: To oversee vehicle testing results and manufacturing defects
Presenter: Automotive Quality Manager
Audience: Engineering team and production managers
6. Telecommunications:
Use: To manage network performance and resolve service-related defects
Presenter: Network Operations Manager
Audience: Technical support team and network engineers
7. Finance and Banking:
Use: To manage software testing for financial applications and compliance tracking
Presenter: Compliance Manager or QA Lead
Audience: IT teams, risk managers, and compliance officers
Quality control kpi dashboard showing test execution status with all 6 slides:
Figure out what the fluctuations indicate with our Quality Control Kpi Dashboard Showing Test Execution Status. It helps interpret changes.
-
Helpful product design for delivering presentation.
-
Informative design.