


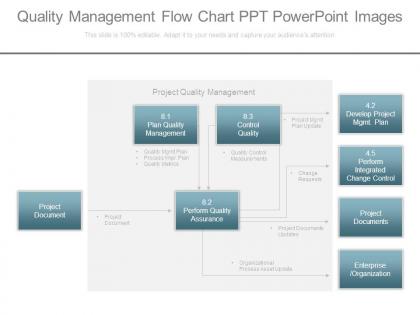
Quality management flow chart ppt powerpoint images




Try Before you Buy Download Free Sample Product
 Impress Your
 Audience
 100%
100% Editable
 Save Hours
 of Time


Our Quality Management Flow Chart Ppt Powerpoint Images enjoy any assignment. They are gluttons for extra effort.
People who downloaded this PowerPoint presentation also viewed the following :
Quality management flow chart ppt powerpoint images with all 7 slides:
Get them dancing with glee with our Quality Management Flow Chart Ppt Powerpoint Images. They allow you to drum up a great beat.

FAQs for Quality management flow chart
Key components of an effective quality management flow chart include process identification, quality checkpoints, decision nodes, corrective action protocols, and continuous feedback loops. These elements work together by mapping quality standards throughout operations, identifying deviation points early, and establishing clear escalation paths, with manufacturing and healthcare organizations finding that structured visual workflows significantly reduce errors while enhancing operational efficiency.
Flow charts facilitate communication within quality management teams by providing visual clarity, standardizing processes, and eliminating ambiguity in complex procedures. These visual tools enable team members to quickly understand workflows, identify responsibilities at each stage, and coordinate effectively across departments, with many organizations finding that standardized visual documentation reduces miscommunication and accelerates problem resolution.
A quality management flow chart serves as the foundation for process improvement by visually mapping current workflows, identifying bottlenecks, redundancies, and inefficiencies that impact operational performance. This strategic tool enables organizations to systematically analyze each process step, implement targeted improvements, and measure outcomes, with many manufacturing and service companies finding that flow chart analysis reduces cycle times by 20-30% while enhancing overall quality standards.
Determining appropriate detail levels involves considering your audience's expertise, the process complexity, and intended use, whether for training, auditing, or daily operations. Organizations typically start with high-level overviews for executives, then create detailed versions for operators and quality teams, with many finding that layered approaches enable better comprehension while maintaining operational clarity and compliance requirements.
Common quality management flow chart symbols include ovals for start/end points, rectangles for process steps, diamonds for decision points, circles for connectors, and arrows for flow direction. These standardized notations streamline quality documentation by enabling clear process mapping, facilitating cross-departmental communication, and supporting compliance audits, with many manufacturing and service organizations finding that consistent symbology enhances training efficiency and reduces process interpretation errors.
Flow charts help identify bottlenecks and inefficiencies by visually mapping each process step, revealing delays, redundancies, and resource constraints that impact workflow. Through this systematic visualization, organizations can pinpoint where tasks accumulate, resources are underutilized, or approval cycles extend unnecessarily, enabling managers to streamline operations, reduce cycle times, and ultimately enhance overall productivity and customer satisfaction.
Quality management flow charts serve as powerful training tools by visualizing complex processes, standardizing procedures, identifying decision points, and highlighting quality checkpoints throughout workflows. Through interactive training sessions, new employees in manufacturing, healthcare, and service industries can quickly grasp quality standards, understand their role in maintaining compliance, and learn troubleshooting protocols, ultimately delivering faster onboarding and consistent quality outcomes.
Common software tools for creating quality management flow charts include Microsoft Visio, Lucidchart, SmartDraw, Draw.io, and Creately, along with specialized quality management platforms like ProcessGene and Nintex. These tools streamline workflow documentation by offering pre-built templates, real-time collaboration features, and integration capabilities, with many organizations finding that cloud-based solutions enhance team coordination and accelerate process improvement initiatives.
Flow charts integrate seamlessly with Six Sigma and ISO 9001 by providing visual documentation for process mapping, root cause analysis, and compliance workflows required by these methodologies. Organizations in manufacturing, healthcare, and financial services leverage flow charts to standardize DMAIC phases, document ISO procedures, and track quality metrics, ultimately delivering enhanced process transparency and faster audit preparations.
Organizations face challenges including resistance to change, inadequate staff training, poor communication across departments, insufficient resource allocation, and difficulty integrating with existing systems. These implementation hurdles can be overcome through strategic change management, comprehensive training programs, and phased rollouts, with many companies finding that early stakeholder engagement and clear communication ultimately deliver smoother adoption and sustained quality improvements.
Quality management flow charts should be reviewed quarterly and updated whenever processes change, regulations evolve, or performance metrics indicate inefficiencies. Many organizations find that regular reviews enable them to identify bottlenecks, streamline workflows, and maintain compliance standards, while process-triggered updates ensure charts reflect actual operations, ultimately delivering improved quality outcomes and operational efficiency.
Best practices for designing quality management flow charts include clear process mapping, standardized symbols, logical sequence flow, defined decision points, and measurable quality checkpoints. These elements streamline operations by enhancing transparency, reducing errors, and enabling consistent quality control, with many manufacturing and service organizations finding that well-designed flow charts ultimately deliver improved compliance and operational efficiency.
A quality management flow chart assists compliance by standardizing processes, documenting procedures, and creating audit trails that regulatory bodies require. Through systematic workflow mapping, organizations in pharmaceuticals, healthcare, and manufacturing ensure consistent quality controls, streamline compliance reporting, and minimize regulatory risks, ultimately delivering transparency and accountability that satisfies industry standards while reducing audit preparation time.
Metrics for assessing quality management flow chart effectiveness include process cycle time, defect reduction rates, compliance adherence levels, customer satisfaction scores, and cost per quality incident. Through tracking these indicators, organizations in manufacturing, healthcare, and financial services streamline operations, minimize errors, and enhance customer experiences, ultimately delivering measurable operational efficiency and competitive advantage.
Visual elements in flow charts enhance quality management understanding by simplifying complex processes, highlighting critical control points, and creating intuitive pathways through decision trees and process stages. Through color-coding, symbols, and clear hierarchies, manufacturing teams, healthcare organizations, and service providers streamline training programs, reduce errors during audits, and improve compliance tracking, ultimately delivering faster onboarding and better process adherence across departments.
-
Design layout is very impressive.
-
Top Quality presentations that are easily editable.