


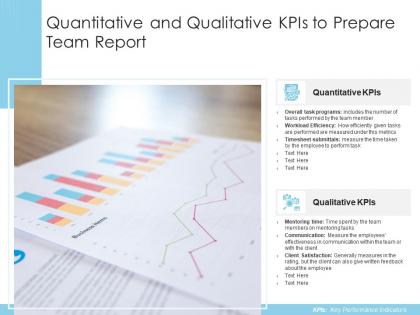
Quantitative and qualitative kpis to prepare team report




Try Before you Buy Download Free Sample Product
 Impress Your
 Audience
 100%
100% Editable
 Save Hours
 of Time


Our Quantitative And Qualitative KPIs To Prepare Team Report are topically designed to provide an attractive backdrop to any subject. Use them to look like a presentation pro.
People who downloaded this PowerPoint presentation also viewed the following :
Quantitative and qualitative kpis to prepare team report with all 2 slides:
Use our Quantitative And Qualitative KPIs To Prepare Team Report to effectively help you save your valuable time. They are readymade to fit into any presentation structure.
FAQs for Quantitative and qualitative kpis to
Common marketing KPIs include customer acquisition cost, conversion rates, return on ad spend, click-through rates, and customer lifetime value. These metrics influence campaign strategies by enabling marketers to optimize budget allocation, refine targeting approaches, and adjust messaging tactics, with many organizations finding that data-driven decisions ultimately deliver higher ROI and more effective customer engagement.
Organizations can determine relevant KPIs by conducting thorough goal analysis, stakeholder consultation, industry benchmarking, and data availability assessment to align metrics with strategic objectives. Through systematic evaluation of business priorities, operational processes, and competitive positioning, companies across sectors like retail, healthcare, and manufacturing identify KPIs that directly measure progress toward specific outcomes, ultimately ensuring strategic focus and measurable performance improvement.
Data visualization transforms complex KPI data into clear, actionable insights through interactive dashboards, trend charts, heat maps, and real-time scorecards that stakeholders can quickly interpret. These visual tools streamline decision-making by highlighting performance patterns, identifying bottlenecks, and enabling faster strategic responses, with many organizations finding that visual KPI presentations increase stakeholder engagement and accelerate business outcomes.
KPIs can be adjusted through regular review cycles, baseline recalibration, target modifications, and metric substitutions that align with evolving objectives. Strategic organizations implement quarterly assessments, benchmark against current market data, and introduce new performance indicators, with retail companies pivoting from foot traffic to digital engagement metrics, ultimately maintaining measurement relevance and competitive positioning.
Best practices for setting realistic KPI targets include analyzing historical performance data, benchmarking against industry standards, aligning with strategic objectives, considering resource constraints, and incorporating stakeholder input. These approaches enable organizations to establish measurable goals that challenge teams while remaining attainable, with many companies finding that balanced target-setting ultimately delivers improved performance and sustained competitive advantage.
Leading KPIs predict future performance through metrics like employee training hours, customer acquisition rates, and pipeline activities, while lagging KPIs measure past results such as revenue, customer satisfaction scores, and market share. Organizations use leading indicators for proactive decision-making and strategic planning, while lagging metrics validate outcomes and assess overall business performance against targets.
KPIs drive employee performance by establishing clear expectations, providing measurable targets, enabling regular feedback, and creating accountability frameworks that align individual contributions with organizational goals. Through transparent performance tracking, employees can identify improvement areas, celebrate achievements, and adjust strategies accordingly, while managers gain insights for targeted coaching, ultimately delivering enhanced productivity, stronger engagement, and competitive operational efficiency across teams.
KPI tracking tools include business intelligence platforms like Tableau and Power BI, analytics software such as Google Analytics, dashboard solutions like Klipfolio, and integrated systems including SAP and Salesforce. These technologies streamline data collection, automate reporting, and provide real-time insights, with many organizations finding that combining multiple platforms delivers comprehensive visibility and faster decision-making capabilities.
Businesses should review KPIs quarterly for operational metrics and annually for strategic indicators, with immediate revisions during major organizational changes, market shifts, or goal pivots. This balanced approach enables companies to maintain agility while ensuring consistency, with many organizations finding that regular assessment cycles enhance performance tracking, strategic alignment, and competitive responsiveness in increasingly dynamic markets.
Companies face challenges including data silos preventing unified tracking, lack of stakeholder buy-in across departments, choosing irrelevant metrics that don't align with strategic goals, and overwhelming teams with too many indicators. These obstacles can be overcome by establishing clear data integration protocols, securing leadership commitment through comprehensive training, focusing on 5-7 strategic KPIs that directly impact business outcomes, and implementing user-friendly dashboards that encourage adoption across organizations.
Qualitative KPIs complement quantitative metrics by capturing employee satisfaction, customer sentiment, brand perception, and cultural alignment that numbers alone cannot measure. While quantitative data reveals what is happening through sales figures and operational metrics, qualitative insights explain why performance occurs, with many organizations finding that combining both approaches delivers comprehensive understanding and strategic advantages.
Over-emphasizing KPIs can create tunnel vision, discourage innovation, promote gaming behaviors, and reduce employee morale through micromanagement. Organizations avoid these pitfalls by balancing quantitative metrics with qualitative insights, regularly reviewing KPI relevance, encouraging experimentation alongside performance targets, and fostering collaborative cultures where metrics support rather than replace strategic thinking and creative problem-solving.
KPIs can be integrated into organizational culture through transparent communication, regular performance reviews, employee training programs, cross-departmental collaboration, and leadership modeling. These approaches foster accountability by enabling clear performance expectations, real-time feedback mechanisms, and shared responsibility for outcomes, with many organizations finding that strategic KPI integration ultimately enhances employee engagement and operational transparency.
Ethical KPI considerations include data privacy protection, transparent methodology disclosure, avoiding manipulative metrics, ensuring stakeholder representation, and preventing discriminatory bias in selection criteria. Organizations must balance performance transparency with employee privacy, avoid cherry-picking favorable data, and ensure KPIs don't inadvertently penalize protected groups, ultimately delivering accountability while maintaining trust and fairness across stakeholders.
Businesses can utilize KPI benchmarking by comparing their performance metrics against industry standards to identify gaps, set realistic targets, and prioritize improvement initiatives. Through systematic analysis of competitor data and industry reports, organizations streamline operations, enhance customer satisfaction, and optimize resource allocation, with many companies finding that strategic benchmarking ultimately delivers measurable competitive advantages and accelerated growth.
-
Appreciate the research and its presentable format.
-
Unique research projects to present in meeting.