

Return on investment evaluate performance adjust strategy investment process




Try Before you Buy Download Free Sample Product
 Impress Your
 Audience
 100%
100% Editable
 Save Hours
 of Time


Our Return On Investment Evaluate Performance Adjust Strategy Investment Process are topically designed to provide an attractive backdrop to any subject. Use them to look like a presentation pro.
People who downloaded this PowerPoint presentation also viewed the following :
Return on investment evaluate performance adjust strategy investment process with all 12 slides:
Use our Return On Investment Evaluate Performance Adjust Strategy Investment Process to effectively help you save your valuable time. They are readymade to fit into any presentation structure.
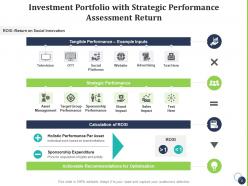
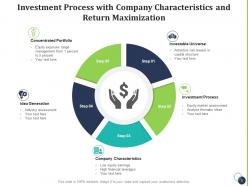
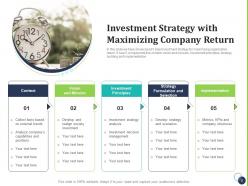
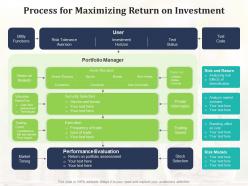
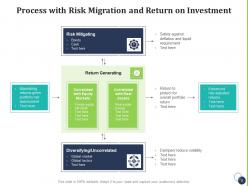
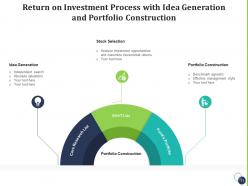

FAQs for Return on investment evaluate performance adjust
Start with CAC, CLV, and conversion rates - they'll show you what's actually moving the needle. Also track your MQLs and how they flow through your funnel. Revenue attribution is honestly a pain to set up, but you need it to see which campaigns are bringing in real money. Engagement stuff like email opens and social shares matter too since they predict future conversions. Oh, and don't go crazy with fancy dashboards right away. Get comfortable with the basics first, then you can add more complex tracking later. Trust me on this one.
Look at which projects could actually make you money and fit what you're trying to do business-wise. Don't just go with your gut - I learned that the hard way. Use data from stuff you've done before to make smarter calls. Put your best people and money on the big wins instead of spreading everything around like peanut butter. Track your numbers obsessively (seriously, this part sucks but you have to do it). Cut the losers fast so you can pump more resources into what's actually working. Being ruthless early saves you tons of headaches later.
Honestly, segmentation is a game changer for ROI. You're literally just focusing your ad spend on people who actually give a damn about your product instead of spraying and praying to everyone. Way more efficient. Different groups respond to different messaging - what works for college students won't work for busy moms, you know? So you split them up by demographics, behavior, whatever makes sense, then create targeted campaigns. Conversion rates go up, costs go down because you're not burning cash on people who'll never buy. I'd start with maybe 3 solid customer segments and test from there.
A/B testing is honestly your best friend for ROI optimization. Start with the big stuff - conversion pages, email campaigns, pricing models. Test one thing at a time though, or you'll go crazy trying to figure out what worked. Your marketing messages, product features, even sales funnel steps are all fair game. I always tell people to focus on long-term value over quick wins - learned that the hard way. Don't just guess what'll work when you can actually test it. Keep it simple at first and track the metrics that actually matter to your bottom line.
Here's what actually works - get both teams tracking the same stuff like customer acquisition cost and lifetime value. Otherwise you're measuring totally different things. Instead of separate goals for leads vs closes, make the revenue target shared. Yeah, weekly meetings sound boring but they help. Marketing should score leads before handing them off, and sales needs to give feedback on lead quality so marketing can fix their targeting. Honestly, the biggest thing is making both sides own the whole customer journey instead of just protecting their own turf. It's messier at first but way more effective.
Dude, analytics tools are game-changers for ROI accuracy. Instead of guessing with spreadsheets, you get actual real-time data showing what's working. Machine learning spots patterns in your historical data that you'd totally miss otherwise - honestly it's kind of scary how good it gets. Predictive models can factor in tons more variables than old-school forecasting. The best part? Automated dashboards let you tweak projections when things change instead of being stuck with outdated numbers. I'd start with one solid platform that pulls from your main data sources. Way less overwhelming than trying to do everything at once.
Honestly, the worst thing you can do is ignore the full customer journey. People don't just see one ad and buy - there's usually multiple touchpoints before they convert. Track your real costs too, not just ad spend. Creative work, tools, your time... it all adds up fast. And attribution windows? Way more crucial than most people realize. Set them too short and you're basically throwing away data on delayed conversions. Higher-ticket stuff especially takes time. My take: start simple with your tracking model. Get that dialed in first before you go crazy with fancy multi-touch attribution. Clean data trumps complex systems every single time.
Honestly, quarterly reviews are the bare minimum these days. Monthly is way better if you can swing it - markets shift too damn fast for anything longer. Do a quick monthly pulse check on your key numbers, then go deeper every quarter where you actually question if your strategy still makes sense. That's worked best for the companies I know that nail this stuff. Just don't overthink it to death, you know? Set up some basic dashboards so you're not hunting for data every month. The goal is staying flexible without changing course every five minutes.
Dude, customer retention is absolutely crucial for ROI - way more cost-effective than constantly hunting for new people. It costs like 5-25x less to keep existing customers happy, and they usually spend more over time too. Most companies mess up the onboarding part (that's where you lose people), so nail that first. Then just stay in touch regularly and show them you're still valuable. I'd track your churn rate and customer lifetime value - helps you catch issues before they blow up. Oh, and definitely reach out to customers who look like they might bail. Much easier than replacing them later.
Honestly, visual templates are a game-changer for ROI stuff. Charts and dashboards beat the hell out of spreadsheets every time - people actually look at them instead of glazing over. I always start with basic bar charts for cost savings, then add timeline views showing how ROI builds over months. The consistency thing is huge too when you're bouncing between different teams who all want their data served up differently. Before/after comparisons work really well for telling the story. Oh, and infographics are great if you're not dealing with super technical folks. Way easier to spot the key metrics at a glance.
Honestly, you've got a huge advantage over big companies - they're stuck in meetings while you can change course tomorrow if needed. Start with the cheap stuff that actually works: digital marketing beats TV ads every time, and keeping current customers happy costs way less than finding new ones. I'd obsessively track your top 3 marketing things right now (like seriously, this week) and see what's actually making you money. Big budgets don't matter if you're throwing cash at the wrong stuff. Once you find what works, just do more of that.
So here's the thing - time horizon basically controls how you discount future cash flows and what hurdle rate makes sense. Long-term projects get messy because uncertainty just keeps building up. Inflation changes, markets shift, your cost of capital moves around. Honestly, trying to predict cash flows beyond 5 years? You're mostly making educated guesses at that point. Money today beats money later, obviously. Higher risk premiums make sense for longer timeframes. My take: run a few different scenarios with various time horizons and discount rates. See how much your ROI actually moves around - might surprise you.
Look at the obvious stuff first - productivity gains, fewer mistakes, better retention rates. Also check how fast new people get up to speed after training. Connecting it directly to your training budget is honestly pretty messy, but whatever. Survey people about confidence levels too - that's where you get the real intel on whether anything actually stuck. Employee engagement scores matter, plus internal promotions and customer satisfaction. Get your baseline numbers before you start, then wait like 6-12 months to see what changed. The qualitative feedback usually tells you more than the spreadsheets anyway.
Start with your bottom line numbers right up front - stakeholders just want to see the money stuff immediately. Charts and graphs are your friend here because honestly, who has time for endless spreadsheets? You'll want to compare against benchmarks or last quarter so they know if you're actually crushing it or not. Breaking things down by segments can make your story way more interesting. Oh, and this is crucial - prep for the "what if we spent more" questions beforehand. Someone always asks about best and worst case scenarios. Have those ready or you'll look unprepared.
Honestly, measuring social ROI used to be such a pain until I figured this out. Set up UTM codes on all your social links first - that way you can actually see which posts send people to your site and then buy stuff. The soft metrics like engagement? Still kinda hate dealing with those, but you can put dollar values on email signups from social posts. Track cost per lead by platform and lifetime value of customers you get through social. Oh, and social listening tools help you see if people are talking about your brand more positively over time. Focus on what actually connects to revenue though.
-
Wonderful templates design to use in business meetings.