


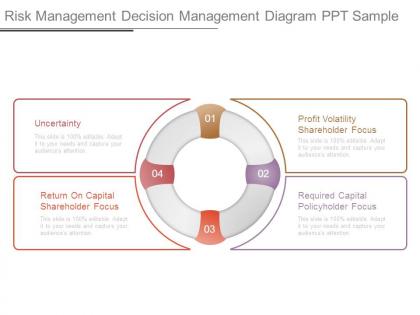
Risk management decision management diagram ppt sample




Try Before you Buy Download Free Sample Product
 Impress Your
 Audience
 100%
100% Editable
 Save Hours
 of Time


Establish your credentials as a good candidate with our Risk Management Decision Management Diagram Ppt Sample. Be able to gear up for the elections.
People who downloaded this PowerPoint presentation also viewed the following :
Risk management decision management diagram ppt sample with all 7 slides:
Address jaded ideas with our Risk Management Decision Management Diagram Ppt Sample. Initiate changes to end any boredom.
FAQs for Risk management decision management
Key elements in a risk management decision diagram include risk identification nodes, probability assessments, impact evaluations, decision points, mitigation strategies, and outcome pathways. These components work together by mapping potential threats, quantifying their likelihood and consequences, and visualizing response options, with many organizations finding that structured decision trees ultimately streamline risk assessment processes and enhance strategic planning efficiency.
Risk management decision diagrams facilitate better communication by providing a shared visual framework that clearly maps risks, decisions, and outcomes in an easily digestible format. These diagrams enable stakeholders across departments to quickly understand complex risk scenarios, align on priorities, and collaborate on mitigation strategies, with many organizations finding that visual risk mapping reduces misunderstandings and accelerates consensus-building processes.
Microsoft Visio, Lucidchart, SmartDraw, and Draw.io offer robust diagramming capabilities for risk management decision trees, while specialized platforms like Palisade DecisionTools and TreeAge Pro provide advanced analytics integration. These tools streamline diagram creation through templates, collaborative features, and data connectivity, with many financial services and healthcare organizations finding that cloud-based solutions enhance team coordination and real-time decision tracking.
The appropriate level of detail depends on decision complexity, stakeholder expertise, and organizational requirements, balancing comprehensive analysis with practical usability. Organizations typically start with high-level risk categories and progressively drill down into specific scenarios, with financial institutions and healthcare systems finding that detailed diagrams enhance regulatory compliance while streamlined versions facilitate faster operational decisions.
Common pitfalls include oversimplifying complex risk scenarios, failing to include stakeholder input, creating overly linear pathways that ignore interdependencies, and neglecting to update diagrams regularly. Many organizations find that poorly designed diagrams lead to delayed response times, missed risk factors, and inconsistent decision-making across departments, ultimately undermining operational efficiency and strategic risk mitigation efforts.
Risk management decision diagrams integrate into existing project management workflows by embedding them into milestone reviews, sprint planning sessions, and change control processes, creating systematic risk evaluation touchpoints throughout project lifecycles. Through digital project management platforms, teams can automate risk assessment triggers, streamline decision documentation, and enhance stakeholder communication, with many organizations finding that this integration delivers faster risk response times and improved project outcomes.
Visual elements that enhance risk management decision diagrams include color coding for risk severity levels, clear hierarchical flowcharts with decision nodes, probability matrices, impact scales, and standardized symbols for different risk categories. These elements streamline risk assessment by enabling quick identification of critical pathways, facilitating faster decision-making processes, and improving stakeholder communication, with many organizations finding that visual clarity ultimately delivers more strategic risk responses and enhanced operational efficiency.
Risk management decision diagrams adapt across industries by customizing risk categories, probability scales, impact metrics, and decision thresholds to reflect sector-specific challenges and regulatory requirements. Financial services focus on credit and operational risks, while healthcare emphasizes patient safety and compliance risks, with manufacturing prioritizing equipment failures and supply chain disruptions, ultimately enabling tailored strategic responses.
Data analytics plays a crucial role in informing risk management decision diagrams by providing quantitative insights, predictive modeling capabilities, historical trend analysis, and real-time risk assessment data. Through advanced analytics tools, organizations can identify emerging threats, calculate probability distributions, and optimize decision pathways, with many financial services and healthcare institutions finding that data-driven risk frameworks significantly enhance operational efficiency and strategic outcomes.
Scenario analysis can be effectively represented through branching pathways that map potential risk events, their probabilities, and corresponding decision points with measurable outcomes. These diagrams incorporate multiple "what-if" scenarios across different risk levels, enabling organizations to visualize decision trees for crisis response, regulatory compliance, and operational continuity, ultimately delivering strategic preparedness and enhanced risk mitigation capabilities.
Risk management decision diagrams enhance regulatory compliance by standardizing risk assessment processes, documenting decision rationales, and creating audit trails that satisfy regulatory requirements. These visual frameworks enable organizations to demonstrate systematic governance approaches, ensure consistent compliance protocols across departments, and streamline reporting to regulatory bodies, ultimately delivering greater transparency and reducing compliance-related risks.
Updating a risk management decision diagram involves adding new risk nodes, reassessing probability and impact scores, and revising decision pathways based on current threat landscapes. Organizations typically conduct quarterly reviews, integrate feedback from incident reports, and incorporate emerging risks like cybersecurity threats or regulatory changes, ensuring their decision frameworks remain dynamic and reflect evolving business environments while maintaining strategic risk mitigation effectiveness.
Qualitative approaches in risk management diagrams use descriptive scales like high, medium, and low probability ratings, while quantitative methods employ numerical data, statistical models, and precise monetary calculations. While qualitative assessments enable faster decision-making and broader stakeholder understanding, quantitative approaches deliver measurable outcomes and detailed financial projections, with many organizations finding that combining both methods enhances strategic risk assessment accuracy.
Organizations can measure diagram effectiveness through key performance indicators like risk identification rates, response time improvements, decision accuracy metrics, and incident reduction percentages. By tracking these measurements quarterly, companies find that well-implemented diagrams typically reduce operational risks by 30-40%, streamline compliance processes, and enhance strategic decision-making, ultimately delivering measurable competitive advantages.
**Training recommendations include risk management certification programs, business analysis workshops, visual mapping courses, decision modeling training, and industry-specific risk assessment programs. These resources enhance teams' abilities to identify potential threats, map decision pathways, and create comprehensive visual frameworks, with many organizations finding that structured training significantly improves risk identification accuracy and strategic decision-making capabilities.** [Word count: 60]
-
Awesomely designed templates, Easy to understand.
-
Great product with highly impressive and engaging designs.