

Roi Analysis Powerpoint Ppt Template Bundles





Try Before you Buy Download Free Sample Product
 Impress Your
 Audience
 100%
100% Editable
 Save Hours
 of Time


Our Roi Analysis Powerpoint Ppt Template Bundles are topically designed to provide an attractive backdrop to any subject. Use them to look like a presentation pro.
People who downloaded this PowerPoint presentation also viewed the following :
Roi Analysis Powerpoint Ppt Template Bundles with all 17 slides:
Use our Roi Analysis Powerpoint Ppt Template Bundles to effectively help you save your valuable time. They are readymade to fit into any presentation structure.
-

ROI Analysis
-
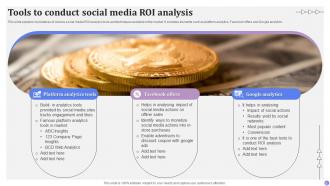
Tools to conduct social media ROI analysis
-
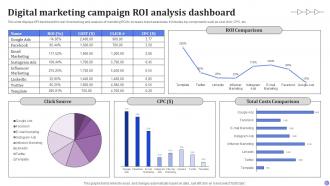
Digital marketing campaign ROI analysis dashboard
-
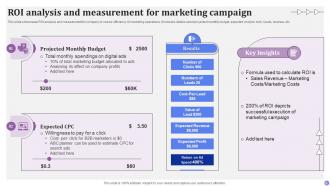
ROI analysis and measurement for marketing campaign
-
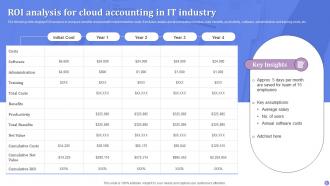
ROI analysis for cloud accounting in IT industry
-
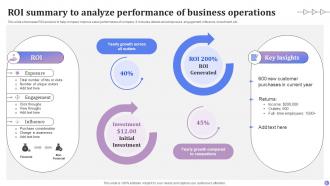
ROI summary to analyze performance of business operations
-
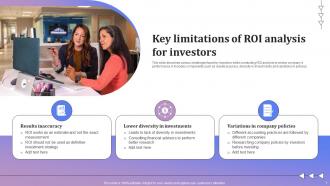
Key limitations of ROI analysis for investors
-
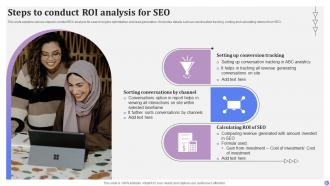
Steps to conduct ROI analysis for SEO
-
ROI analysis icon showcasing increasing returns
-
ROI analysis icon for funds invested by company
-
Icon showcasing ROI analysis with magnifier
-

Thanks for watching
-

-

-

-

-

FAQs for Roi Analysis Powerpoint
Honestly, you need to track four main things: what you spent upfront, your ongoing costs, whatever money/benefits come back, and the timeframe you're looking at. The hard part? Putting actual numbers on stuff like customer happiness or brand boost - but do your best. Also think about opportunity cost - like what else you could've done with that cash instead. Oh and definitely run a few different scenarios with your assumptions, because let's be real, your first guess probably won't be perfect. Just make sure you're comparing the same time periods across everything.
Honestly, you gotta use proxy metrics since you can't put exact dollar signs on everything. Track retention rates for employee satisfaction - then calculate what you're saving on turnover costs. Brand reputation is trickier, but watch how your customer acquisition costs change over time. Yeah, some of it feels like educated guessing (because it kinda is). Faster decision-making? Measure project completion times or how quickly you're getting to market. The main thing is staying consistent with whatever method you pick and writing down your assumptions. That way you can actually improve the process later instead of just winging it every time.
Yeah, timing is everything with ROI calculations - mess this up and your whole analysis is garbage. You've gotta wait for benefits to actually show up, not just measure when it's convenient. Training programs are the worst for this - people check after like 30 days and wonder why the numbers suck. Most investments need way more time to pay off than you think. Figure out your typical breakeven point first, then measure way past that. I usually map out when I expect things to start working, then tack on extra time because stuff always takes longer than planned.
Look, ROI isn't one-size-fits-all - you've gotta tailor it to your industry. Tech companies obsess over user acquisition costs and lifetime value. Manufacturing? They're all about equipment efficiency and production numbers. Healthcare's totally different - patient outcomes and cost per case matter way more than generic financial stuff. Honestly, most people skip this step and wonder why their metrics feel useless. Figure out what actually drives success in your space first. Then build your ROI calculations around those specific things. Oh, and definitely check what your competitors are tracking for benchmarks.
Don't compare projects from different time periods or with totally different scopes - you'll get garbage results. Cherry-picking data is tempting (trust me), but it'll bite you later. Time value of money and opportunity costs matter more than people think. ROI isn't everything either - sometimes the strategic benefits are worth way more than the numbers show. Keep your assumptions consistent across calculations, otherwise what's the point? Document how you did everything so you're not scrambling to explain your logic six months from now. Risk factors can completely change the picture too.
Yeah, higher upfront costs definitely hurt your ROI at first. But honestly? They don't always wreck your long-term returns. If you're putting money into quality stuff - better tech, skilled people, solid infrastructure - that usually pays off down the road. Less maintenance headaches, things run smoother, better results overall. The real question is whether you're actually buying value or just burning cash because it feels fancy. I'd probably run a few different scenarios to see how the numbers play out over time. Makes the decision way less of a guessing game.
Predictive analytics takes your old data and spots patterns to predict future ROI way better than basic forecasting. You can factor in market trends, seasonal stuff, and how customers actually behave - not just guess based on last year's numbers. Machine learning beats the hell out of Excel projections, honestly. The cool part is you get probability ranges instead of one random estimate. Different scenarios? It'll run those too. Oh, and make sure your historical data is clean first - garbage in, garbage out, you know? That's where everything starts.
Start with your ROI percentage right up front - that's literally all they care about. Charts work way better than spreadsheets because nobody wants to squint at numbers. Break down how you calculated everything so they can follow your logic. Always include timeframes too. If you've got industry benchmarks, throw those in for comparison. Connect everything back to what the business actually needs. Oh, and prep some backup slides - someone's definitely gonna ask "what happens if this assumption is wrong?" Trust me on that one. You'll want those ready.
So first thing - grab financial data from 3-4 competitors who are actually similar to you. Industry reports from McKinsey or PwC have tons of good stuff, plus trade publications and IBISWorld. Here's the annoying part though: everyone calculates ROI differently, so try to compare similar project types and timeframes. Otherwise you're just shooting in the dark. I always throw everything into a basic spreadsheet to track quarterly changes - nothing fancy needed. Oh and don't just aim for industry average, that's pretty mediocre. Go for top 25th percentile instead.
Excel's probably your best bet since you already know it - just build a template with formulas and you're set. Power BI or Tableau are solid if you want prettier charts. There's fancier stuff like Anaplan but honestly? I've seen companies blow crazy money on tools that barely save time. Google Sheets works great too, especially if others need to jump in and edit. My old boss went nuts buying some $10k software when a simple spreadsheet would've done the trick. Start with whatever you've got, then upgrade later if you hit walls. One good template beats expensive software you don't need.
Honestly, ROI analysis is a game-changer for this stuff. Just calculate expected returns vs costs for each project, then rank them by percentage. Pretty simple once you do it a few times. The best part? It stops that annoying "everything's urgent" cycle that drives everyone crazy. I usually set a threshold too - like nothing under 15% ROI gets funding. Weeds out the meh ideas before they drain your budget. Try running the numbers on whatever projects you've got lined up and see what rises to the top. You'll probably be surprised by the results.
Honestly, your metrics can make or break how good your ROI looks. Track only revenue while ignoring what it costs to get customers? You'll seem amazing until someone actually looks at the numbers. I've watched teams fight for literally months over gross vs net revenue - it gets messy. Different metrics show different things too. Some give you quick financial wins, others capture the longer stuff like brand awareness or lifetime value. Pick what actually matches your goals and just be upfront about what you're measuring. Define everything at the start and don't change it halfway through.
ROI analysis is like having a roadmap for your business decisions. Without it, you're just throwing money at whatever sounds cool (been there, done that). It shows you which projects actually deserve your budget and attention. The numbers don't lie - they tell you if something supports your bigger goals or if it's just a waste of time. Plus, when you can prove ROI to your boss or investors, they trust your judgment way more. My advice? Start measuring ROI on what you're doing now. You'll be shocked at what's working versus what isn't.
Honestly, tracking marketing ROI isn't as scary as it sounds. Just take your revenue minus what you spent, divide by campaign cost, then multiply by 100. Like if you drop $1,000 and bring in $3,000 in sales, boom - 200% ROI. The annoying part? Figuring out which campaign actually drove the sale, especially if people take forever to buy. I'd also watch your cost per lead and conversion rates - those tell you way more than just the final number. Oh, and seriously set up tracking right away. Trust me, you don't want to be that person frantically trying to justify your budget later.
Don't cherry-pick your data or hide the messy stuff - people are making real decisions based on what you tell them. Always mention your assumptions upfront and what timeframe you're working with. Honestly, I've sat through way too many presentations where they magically forgot about implementation costs or only showed the sunny scenarios. When there's uncertainty, just say so. Run sensitivity analysis with best and worst cases. Your reputation depends on giving people the full picture, not just the parts that make everything look amazing.
-
Best Representation of topics, really appreciable.
-
Very unique and reliable designs.