


Sample Financial Forecasting Powerpoint Presentation Slides




Try Before you Buy Download Free Sample Product
 Impress Your
 Audience
 100%
100% Editable
 Save Hours
 of Time


Explore our content ready Sample Financial Forecasting PowerPoint Presentation Slides. This Financial planning Presentation helps you to set long term financial Goals. Financial forecasting and budgeting PowerPoint complete deck cover all the necessary slides such as, budgeting template, planned vs actual comparison, product launch budget plan, company budget, event budget, social media budget template etc. All templates are 100 % editable in PowerPoint so that users can enter text in the placeholders, change colours if they wish to and present in the shortest possible time. Furthermore, budget planning presentation graphics can also be used to portray related topics like financial highlights, financial growth analysis, financial planning timeline, resource capacity planning, budget financial plan, new capital budgeting, budget monitoring process, tax planning, and more. Showcase the steps in financial planning process using this budget planning PowerPoint visuals. Download ready to use budget plan PPT templates to present financial projections. Increase the gap between you and the competition with our Sample Financial Forecasting Powerpoint Presentation Slides. It allows you to inch ahead.
People who downloaded this PowerPoint presentation also viewed the following :
Content of this Powerpoint Presentation
Slide 1: This slide introduces Sample Financial Forecasting. State Your Company Name and begin.
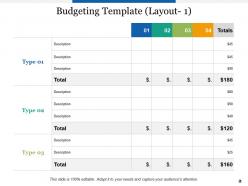
Slide 2: This slide shows Budgeting Template in table form with Type, Description, Numbers and Total budget.
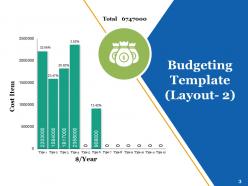
Slide 3: This slide is another budget template in a bar garph form showing cost items and budget of the year. You can edit and change data as per requirements.
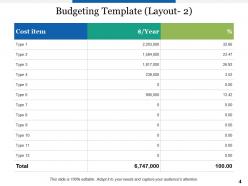
Slide 4: This too is a Budgeting Template slide in table form with Cost items, Budget per year and percentage of cost as per the budget.
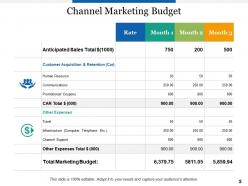
Slide 5: This slide represents Channel Marketing Budget describing Anticipated total sales, Human resource, Communications, Promotional/ Coupons, Total customer acquisition and retention cost, Other expenses like travel, infrastructure etc and Total marketing budget.
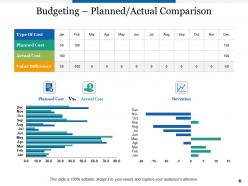
Slide 6: This slide showcases Budgeting – Planned/Actual Comparison with graphs and table. You can add or edit data as per requirements.
Slide 7: This slide shows the Product Launch Budget Plan with the help of a bar graph. This slide also shows data in percentage, you can change it as per needs.
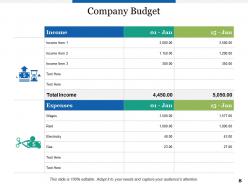
Slide 8: This slide presents Company Budget in table form describing income and expenses.
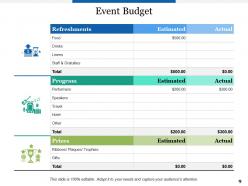
Slide 9: This slide displays Event Budget describing Refreshments, Program and prizes.
Slide 10: This slide represents Product Launch Marketing Budget Template describing- Public Relations, Web Marketing, Advertising and Collateral.
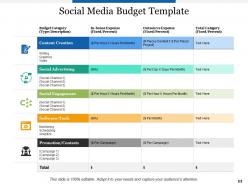
Slide 11: This slide showcases Social Media Budget Template describing In-house and outsource expenses of Content creation, Social advertising, Social engagement, Software/tools and promotion/contests.
Slide 12: This slide is titled Additional slides for moving forward. You may change the content as per need.
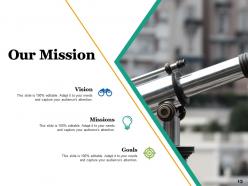
Slide 13: This is Our mission slide with imagery and text boxes to go with.
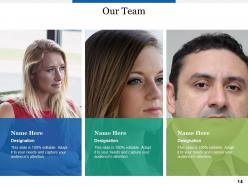
Slide 14: This is Our team slide with names and designation.
Slide 15: This is an About us slide to state company specifications etc.
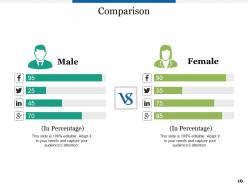
Slide 16: This is a Comparison slide to state comparison between commodities/ entities etc.
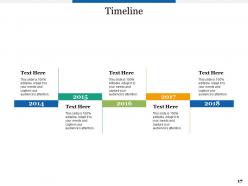
Slide 17: This is a Timeline slide. Show information related with time period here.
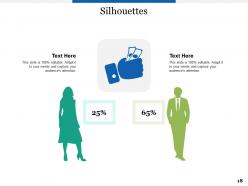
Slide 18: This is a People's silhouettes slide. Use it the way you want to show solutions etc.
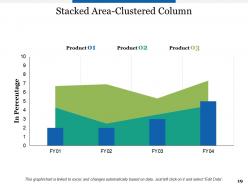
Slide 19: This slide shows a Stacked Area-Clustered Column chart with three products comparison.
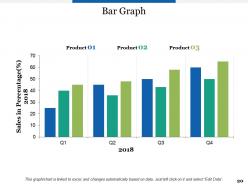
Slide 20: This slide shows a Bar Graph with three product comparison.
Slide 21: This is a Thank You slide with Address# street number, city, state, Contact Number, Email Address.
Sample Financial Forecasting Powerpoint Presentation Slides with all 21 slides:
Create heaven on earth with our Sample Financial Forecasting Powerpoint Presentation Slides. Give them all a divine experience.





FAQs for Sample Financial Forecasting
So there's basically two ways to tackle forecasting. Quantitative stuff uses your historical data - moving averages, regression models, time series analysis. Works great if you've got decent past numbers to crunch. Then there's qualitative, which is more expert opinions and market research. Honestly feels like fancy guesswork sometimes, but you need it for new products or when markets go crazy. Here's the thing - quantitative assumes your past trends will keep going, but qualitative lets you adjust for weird changes coming up. I'd probably start with the numbers approach for your foundation, then tweak it based on whatever industry changes you're expecting.
Look, you need that historical data to see what's actually happening instead of just winging it. Two years is decent if that's what you have - more is obviously better. Check your revenue and expense patterns from the last few quarters first. That'll show you seasonal stuff, growth rates, how you usually react when the market gets weird. Without it you're basically flying blind and missing obvious trends. It builds way more realistic assumptions too, which honestly saves you from looking stupid later when your projections are completely off.
So economic indicators are like having a heads up on where things might go financially. GDP growth, unemployment, inflation, consumer spending - all that stuff directly hits markets and how businesses do. Leading indicators are way better than lagging ones since they actually predict instead of just telling you what already happened. Job openings are a good example there. Honestly, nothing's foolproof but this gets you pretty close to knowing what's coming. Just focus on whichever indicators actually matter for your industry or whatever you're investing in first.
So basically you want to dig into your historical data - revenue, expenses, all that stuff - and look at it quarterly or yearly to see what direction things are heading. Start with 3-5 years if you've got it (though honestly, more is always better). Don't just draw straight lines forward though - that's where people mess up. Think about seasonal stuff, market shifts, business cycles that'll mess with your trends. Oh and definitely don't forget to update your forecasts regularly when new data rolls in. Nothing worse than being stuck with assumptions from six months ago when everything's changed.
Honestly, the worst part is when your data is just messy - incomplete records, inconsistent formatting, all that fun stuff. Makes your models garbage right off the bat. Then you've got all these external curveballs like market crashes or, you know, global pandemics that nobody saw coming. Plus we're all biased whether we admit it or not - either way too optimistic or playing it super safe. I've learned to just build multiple scenarios instead of pretending one forecast will nail it. Update your assumptions constantly too, because things change fast.
Market volatility basically screws with your forecasts - the further out you go, the more unreliable they get. Your assumptions about growth, currency shifts, all that stuff can fall apart fast when things get chaotic. Honestly, it's worse than trying to guess what you'll want for dinner next Tuesday. Build in some wiggle room and update your models way more often when volatility hits. I'd do multiple scenarios - best case, disaster mode, realistic middle ground. Also shorten those forecast windows during crazy periods. You'll still get surprised sometimes, but at least you won't be completely blindsided.
Honestly, scenario planning saves my ass every time - do best case, worst case, and realistic so nothing blindsides you. Rolling forecasts beat annual ones hands down since you're always working with fresh data. Sensitivity analysis is clutch for seeing how tweaking key variables messes with your numbers. Monte Carlo gets nerdy but it's solid if you want probability distributions (though maybe overkill depending on your situation). The real game changer? Actually tracking how accurate your forecasts were and tweaking your approach based on what went wrong. Most people skip that last part.
You really can't forecast retail without seasonal trends - learned that the hard way when I first started analyzing data. Pull like 2-3 years of historical sales to spot the patterns. Holiday quarters are obvious gold mines, but don't forget weird stuff like swimwear exploding in March when people panic about beach season. Build those seasonal multipliers right into your baseline model. I've watched so many retailers crash because they ignored this basic step. Short version: identify your cycles first, then layer everything else on top.
Look, quantitative stuff gives you solid numbers your boss can't argue with - perfect for spotting patterns in old data. But qualitative methods? That's where you catch the human element, like when markets are shifting or competitors do something unexpected. I learned this the hard way honestly. Best approach is starting with your number-based forecast as the foundation. Then throw in those qualitative insights to adjust for weird stuff - new regulations, economic chaos, whatever. You'll dodge way more surprises that pure spreadsheet analysis would totally miss. Short bursts work great too.
Honestly? Excel's still king for financial forecasting. Everyone knows it, it's flexible, and you won't blow your budget. If you need fancy charts, Tableau or Power BI are solid. Big companies usually go with Adaptive Insights or Workday for the heavy-duty planning stuff. Between you and me, I've watched people crush forecasts using just Google Sheets (finance directors would probably have a heart attack hearing that). The real trick isn't finding the coolest tool - it's using whatever your team already knows inside and out. Start there, then upgrade when you actually hit walls.
Quarterly updates work for most businesses, but it really depends on your industry. Tech and retail? You'll probably need monthly revisions since everything moves so fast. Utilities and other stable sectors can get away with every six months or so. Watch for triggers like major market changes, product launches, big customer wins/losses, or cost structure shifts - that's when you need to update regardless of schedule. Honestly, the hardest part is not getting so caught up in forecasting that you forget to actually run your business. Find that balance where you're current but not obsessing over spreadsheets all day.
Think of scenario planning as your backup plan for when things go sideways - and trust me, they will. You create different versions of what might happen: best case, worst case, and the realistic middle ground. That way you're not scrambling when the market tanks or some random event hits your business. Pick 3-4 big factors that could mess with your numbers, then run models for each possibility. Honestly, I've seen too many companies get blindsided because they only planned for sunshine and rainbows. Build your contingency plans now while you've got time to think clearly.
Break down your forecasts into clear assumptions instead of just dumping numbers on people. Charts and graphs are your friend - spreadsheets make everyone's eyes glaze over. Explain your methodology first, then highlight the biggest risks that could flip your projections. Don't oversell how certain you are either. Acknowledge where you're basically making educated guesses. Regular updates beat annual presentations every time. I learned this the hard way after a few painful board meetings where I way overconfident about my numbers. Try it with your next deck and see how it goes.
Honestly, just be super upfront about what you don't know and where your numbers might be off. Don't cherry-pick data to tell leadership what they want to hear - though yeah, I get that's tough when they're breathing down your neck. Document everything so people can actually check your work later. Think about who gets hurt by these forecasts too, especially if you're predicting layoffs or whatever. Give them uncertainty ranges instead of acting like you can predict the future perfectly. Oh, and maybe prepare for pushback when you're being realistic instead of optimistic.
Dude, AI is totally changing how financial forecasting works. Machine learning can crunch huge amounts of data super fast and catch patterns we'd never see. The algorithms keep learning from new info, so predictions actually improve over time - which is pretty cool. Traditional models just can't handle market craziness like this tech can. But honestly? You still need humans in the loop to make sense of what the data's telling you. I'd suggest starting with small test runs before you go all-in and remake your whole system. Way less risky that way.
No Reviews