


Servicenow Performance Analytics For HR Service Delivery Complete Deck





Try Before you Buy Download Free Sample Product
 Impress Your
 Audience
 100%
100% Editable
 Save Hours
 of Time


Collaboration of IT and business drive efficiencies, stabilize the business, and help in cost containment. Grab our efficiently designed ServiceNow Performance Analytics for HR Service Delivery template that illustrates how advanced Machine Learning ML and Artificial Intelligence AI analytic models can maximize service delivery performance, service health, and proactive problem resolution. Also, this presentation acquaints viewers with a list of machine learning skills that organizations must use to handle service abnormalities, etc. In addition to that, our professionally curated PPT presents details on the application of new customer engagement models by aligning HR, finance, legal, customer support, and sales and marketing team. Further, this PPT provides rich information on shifting from transactional services to transforming the entire stack, building a new IT culture, etc. Our ready-to-use PowerPoint presentation will help you conduct your employees AI and Machine Learning Training Program. It will also be helpful in the transformation from reactive service to proactive service, creating values for business stakeholders and devising a communication plan along with service delivery KPI dashboards. Customize this 100 percent editable template now.
People who downloaded this PowerPoint presentation also viewed the following :
Content of this Powerpoint Presentation
Slide 1: This slide introduces ServiceNow Performance Analytics for HR Service Delivery. State Your Company Name and begin.
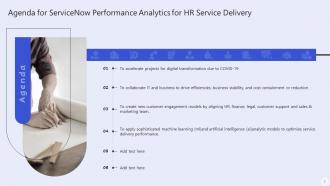
Slide 2: This slide states Agenda of the presentation.
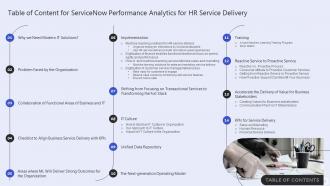
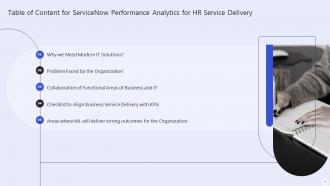
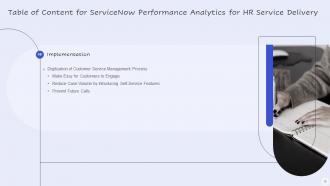
Slide 3: This slide presents Table of Content for the presentation.
Slide 4: This slide highlights title for topics that are to be covered next in the template.
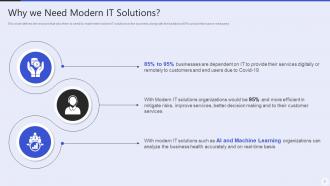
Slide 5: This slide defines the reasons that why there is need to implement modern IT solutions.
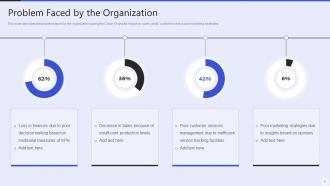
Slide 6: This slide describes the problems faced by the organization during the Covid-19 and its impact on sales.
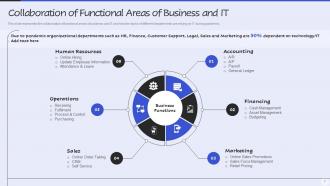
Slide 7: This slide displays Collaboration of Functional Areas of Business and IT.
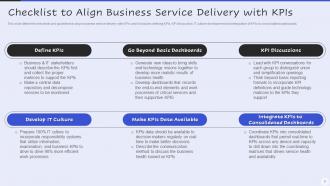
Slide 8: This slide represents Checklist to Align Business Service Delivery with KPIs.
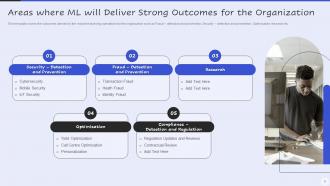
Slide 9: This slide showcases Areas where ML will Deliver Strong Outcomes for the Organization.
Slide 10: This slide highlights title for topics that are to be covered next in the template.
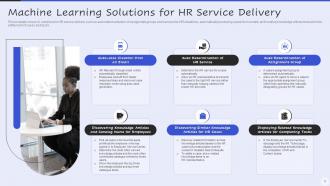
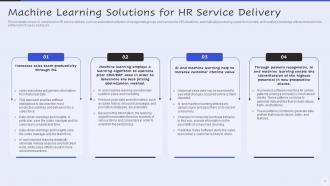
Slide 11: This slide shows Machine Learning Solutions for HR Service Delivery.
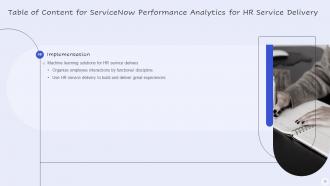
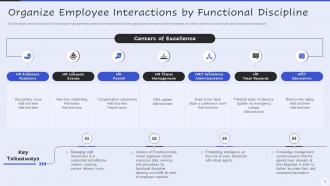
Slide 12: This slide presents Organize Employee Interactions by Functional Discipline.
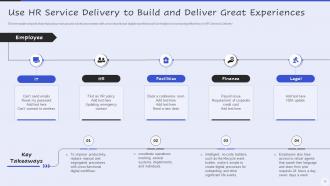
Slide 13: This slide displays Use HR Service Delivery to Build and Deliver Great Experiences.
Slide 14: This slide highlights title for topics that are to be covered next in the template.
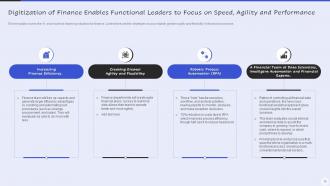
Slide 15: This template covers the AI and machine learning solutions for finance.
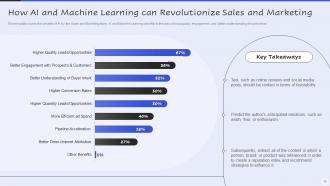
Slide 16: This slide represents How AI and Machine Learning can Revolutionize Sales and Marketing.
Slide 17: This slide showcases Machine Learning Solutions for Sales and Marketing Service Delivery.
Slide 18: This slide highlights title for topics that are to be covered next in the template.
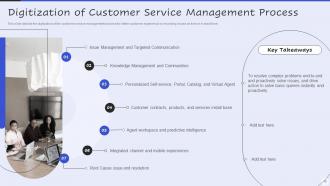
Slide 19: This slide shows Digitization of Customer Service Management Process.
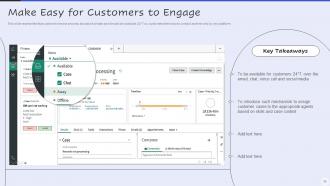
Slide 20: This slide represents that customer service process should be simple.
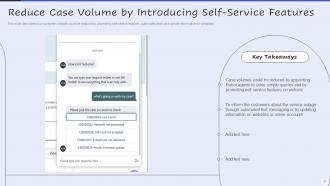
Slide 21: This slide showcases Reduce Case Volume by Introducing Self-Service Features.
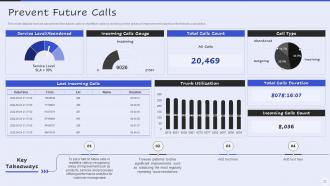
Slide 22: This slide depicts how we can prevent the future calls or repetitive calls by working on the areas of improvement.
Slide 23: This slide highlights title for topics that are to be covered next in the template.
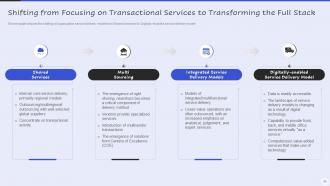
Slide 24: This slide shows Shifting from Focusing on Transactional Services to Transforming the Full Stack.
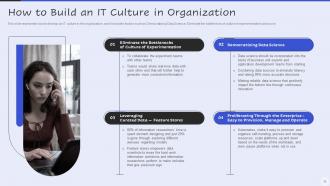
Slide 25: This slide represents how to develop an IT culture in the organization.
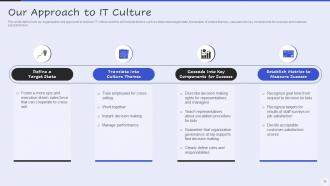
Slide 26: This slide define how our organization will approach to build an IT culture.
Slide 27: This slide represents the impact of IT culture in the organization.
Slide 28: This slide highlights title for topics that are to be covered next in the template.
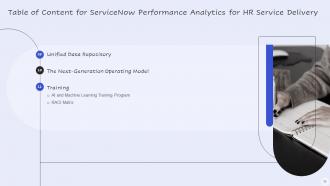
Slide 29: This slide showcases Unified Data Repository from Across Various Systems to Collect the Matrices for Multiple Users.
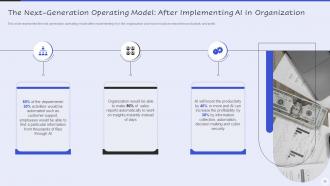
Slide 30: This slide represents the next generation operating model after implementing AI in the organization.
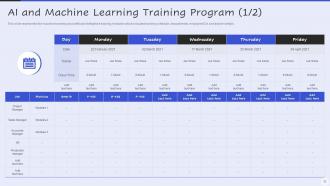
Slide 31: This slide showcases AI and Machine Learning Training Program.
Slide 32: This slide shows AI and Machine Learning Training Program.
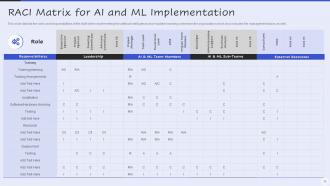
Slide 33: This slide presents RACI Matrix for AI and ML Implementation.
Slide 34: This slide highlights title for topics that are to be covered next in the template.
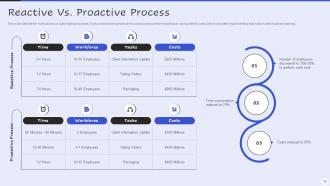
Slide 35: This slide depicts the manual versus automated processes.
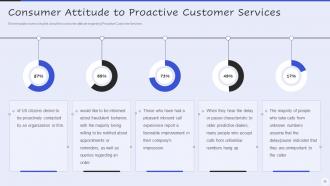
Slide 36: This slide represents Consumer Attitude to Proactive Customer Services.
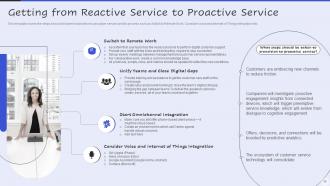
Slide 37: This slide showcases Getting from Reactive Service to Proactive Service.
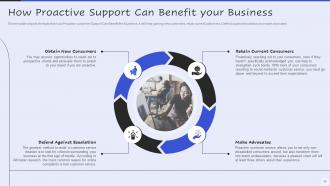
Slide 38: This slide shows How Proactive Support Can Benefit your Business.
Slide 39: This slide highlights title for topics that are to be covered next in the template.
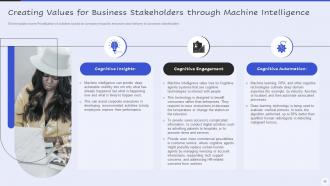
Slide 40: This slide presents Creating Values for Business Stakeholders through Machine Intelligence.
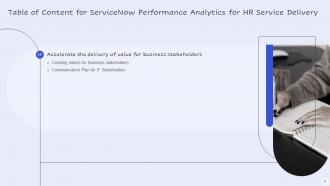
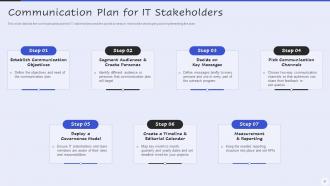
Slide 41: This slide depicts the communication plan for IT stakeholders.
Slide 42: This slide highlights title for topics that are to be covered next in the template.
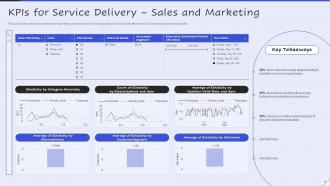
Slide 43: This slide describes how sales and marketing will be boost by incorporating AI.
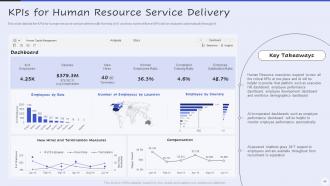
Slide 44: This slide depicts the KPIs for human resource service delivery with the help of AI.
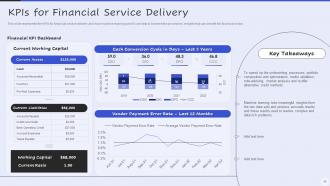
Slide 45: This slide represents the KPIs for financial service delivery.
Slide 46: This slide is titled as Additional Slides for moving forward.
Slide 47: This is About Us slide to show company specifications etc.
Slide 48: This is Our Mission slide with related imagery and text.
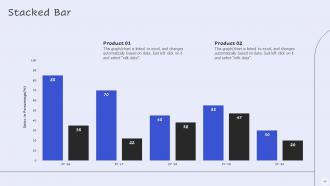
Slide 49: This slide represents Stacked Bar chart with two products comparison.
Slide 50: This slide showcases Roadmap for Process Flow.
Slide 51: This slide shows Post It Notes. Post your important notes here.
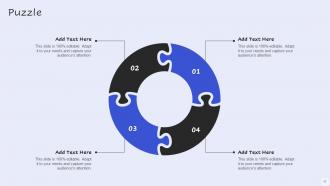
Slide 52: This slide contains Puzzle with related icons and text.
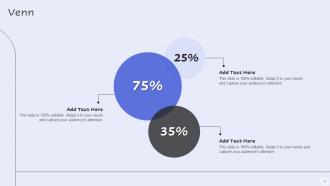
Slide 53: This slide depicts Venn diagram with text boxes.
Slide 54: This is a Thank You slide with address, contact numbers and email address.
Servicenow Performance Analytics For HR Service Delivery Complete Deck with all 59 slides:
Use our Servicenow Performance Analytics For HR Service Delivery Complete Deck to effectively help you save your valuable time. They are readymade to fit into any presentation structure.










FAQs for Servicenow Performance Analytics For HR Service
Essential KPIs for performance analytics include revenue growth, customer acquisition costs, operational efficiency metrics, employee productivity rates, and customer satisfaction scores. These indicators enable organizations to streamline decision-making, enhance resource allocation, and accelerate strategic improvements, with many businesses finding that comprehensive KPI tracking ultimately delivers competitive advantage and measurable outcomes.
Organizations leverage performance analytics to enhance decision-making by providing real-time insights into operational efficiency, identifying performance bottlenecks, and enabling data-driven strategic planning through comprehensive dashboards and predictive modeling. These analytics systems streamline resource allocation, accelerate response times to market changes, and deliver competitive advantages, with many financial services and retail companies finding significantly improved forecasting accuracy and operational outcomes.
Data visualization transforms complex performance analytics into actionable insights by presenting data through interactive dashboards, heat maps, trend charts, and real-time scorecards that highlight patterns and anomalies. Through visual representations, organizations streamline decision-making processes, accelerate problem identification, and enhance cross-functional communication, with many finding that visual analytics ultimately delivers faster strategic responses and improved operational efficiency.
Machine learning and AI technologies enhance performance analytics by automating data processing, identifying complex patterns, and providing predictive insights that traditional analytics miss. These technologies streamline decision-making by delivering real-time performance monitoring, intelligent anomaly detection, and personalized recommendations, with many organizations finding that AI-driven analytics ultimately reduce operational costs while accelerating strategic responses.
Companies face challenges including data silos across departments, inconsistent metrics definitions, resistance to data-driven culture changes, and integration complexities with existing systems. While these obstacles can slow initial implementation, organizations in sectors like retail and manufacturing find that addressing data quality and employee training first streamlines the process, ultimately delivering enhanced decision-making capabilities and operational efficiency.
Performance analytics can be tailored through industry-specific metrics, customized dashboards, sector-relevant benchmarking, and specialized reporting frameworks that address unique operational requirements. Financial services focus on risk assessment and compliance tracking, while healthcare emphasizes patient outcomes and resource utilization, ultimately enabling organizations to measure what matters most for their strategic objectives.
Key performance metrics include productivity measures, quality indicators, goal achievement rates, collaboration effectiveness, and professional development progress. These metrics work together to provide comprehensive insights into individual contributions, with many organizations finding that combining quantitative data with qualitative feedback delivers more accurate assessments and ultimately enhances workforce optimization strategies.
Performance analytics enhances customer experience by identifying service bottlenecks, predicting customer needs, and optimizing touchpoint interactions across digital and physical channels. Through real-time data analysis, companies in retail, banking, and hospitality can reduce wait times, personalize offerings, and proactively address issues, ultimately delivering faster services and more satisfying customer journeys.
Performance analytics tools include Tableau, Power BI, Google Analytics, Adobe Analytics, and Splunk for comprehensive data visualization and insights. These platforms streamline decision-making by automating data collection, providing real-time dashboards, and enabling predictive modeling, with many organizations finding that strategic analytics implementation delivers faster reporting, enhanced operational efficiency, and significant competitive advantage.
Cultural factors significantly influence performance analytics interpretation through varying communication styles, hierarchical structures, risk tolerance levels, and decision-making processes across different regions and organizations. While Western cultures may emphasize individual performance metrics, collectivist cultures focus on team outcomes, with many global organizations finding that standardizing analytics frameworks while allowing cultural adaptation ultimately delivers more accurate insights and better employee engagement.
Real-time data processing revolutionizes performance analytics by enabling immediate insights, reducing response times, and facilitating proactive decision-making across organizations. Through continuous monitoring and instant analysis, businesses in sectors like financial services, retail, and manufacturing can identify performance bottlenecks, optimize operations instantly, and deliver enhanced customer experiences while maintaining competitive advantage.
Businesses ensure data accuracy and integrity through automated validation systems, regular data audits, standardized collection protocols, and real-time monitoring dashboards. Through these comprehensive measures, organizations across healthcare, finance, and retail minimize errors, enhance decision-making confidence, and ultimately deliver more reliable insights that drive strategic outcomes and competitive advantage.
Performance analytics directly informs strategic business planning by providing data-driven insights into operational efficiency, market trends, resource allocation, and competitive positioning across key business functions. This strategic combination enables organizations to make evidence-based decisions, identify growth opportunities, and optimize long-term planning, with many companies finding that analytics-driven strategies deliver measurable competitive advantages and sustainable business outcomes.
Organizations can measure ROI of performance analytics initiatives by tracking cost savings from operational improvements, revenue increases from data-driven decisions, and efficiency gains from automated reporting and faster insights. Through comprehensive metrics like reduced processing times, improved customer satisfaction scores, and enhanced decision-making speed, companies typically find measurable returns within 12-18 months, ultimately delivering competitive advantage and strategic value.
Performance analytics presents both opportunities and ethical responsibilities, requiring careful attention to data privacy, algorithmic bias, transparency in measurement criteria, employee consent, and fair representation across diverse groups. Organizations must balance performance insights with respect for individual rights, ensuring that analytics enhance rather than undermine workplace trust, while establishing clear guidelines that protect employees from discriminatory practices and promote equitable evaluation processes.
-
Excellent Designs.
-
I have been using SlideTeam for the past six months. Very happy and satisfied!