


Status Report With Executive Summary Milestones Best Practices Successful Project




Try Before you Buy Download Free Sample Product
 Impress Your
 Audience
 100%
100% Editable
 Save Hours
 of Time


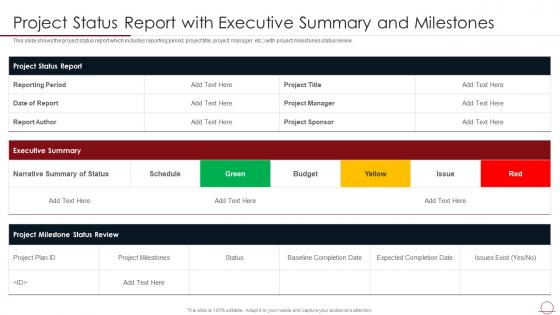
This slide shows the project status report which includes reporting period, project title, project manager, etc. with project milestones status review.
People who downloaded this PowerPoint presentation also viewed the following :
Status Report With Executive Summary Milestones Best Practices Successful Project with all 6 slides:
Use our Status Report With Executive Summary Milestones Best Practices Successful Project to effectively help you save your valuable time. They are readymade to fit into any presentation structure.





FAQs for Status Report With Executive Summary Milestones Best
A comprehensive status report should include project milestones achieved, current task progress, budget utilization, resource allocation, identified risks, and upcoming deliverables with timelines. These components enable stakeholders to assess project health quickly, make informed decisions about resource adjustments, and maintain strategic alignment, with many organizations finding that structured reporting enhances accountability and accelerates project delivery.
Visual elements enhance status report clarity by incorporating charts, graphs, color-coded indicators, infographics, and progress bars that transform complex data into digestible insights. These design components streamline information processing, highlight critical milestones and variances, and enable stakeholders to quickly grasp project trajectories, ultimately delivering faster decision-making and improved strategic alignment across organizations.
Common pitfalls include overwhelming stakeholders with excessive technical details, failing to highlight critical risks and roadblocks, providing outdated information, and lacking clear next steps or actionable insights. These issues undermine stakeholder confidence and decision-making effectiveness, with many organizations finding that streamlined, focused reports with visual summaries and strategic priorities ultimately enhance communication and project outcomes.
Status reports should typically be updated weekly for ongoing projects, though frequency varies based on project complexity, stakeholder needs, and organizational requirements. This regular cadence enables project managers to maintain transparency, catch potential issues early, and keep all stakeholders aligned, with many organizations finding that consistent weekly updates significantly enhance communication efficiency and project success rates.
Technology tools streamline status report compilation through automated data collection, real-time dashboard integration, template standardization, collaborative editing platforms, and intelligent formatting systems. These solutions minimize manual data entry, reduce compilation time, and enhance accuracy across project management workflows, with many organizations finding that automated reporting delivers faster insights, improved transparency, and ultimately enables teams to focus more strategic activities.
Teams effectively measure and report KPIs in status reports by establishing clear baseline metrics, implementing automated tracking systems, using visual dashboards, and conducting regular performance reviews with stakeholder input. Through strategic data visualization and consistent reporting frameworks, organizations streamline decision-making processes, enhance transparency across departments, and ultimately deliver improved project outcomes, with many teams finding that standardized KPI reporting accelerates issue resolution and drives competitive advantage.
Tailoring status report strategies include audience segmentation, content prioritization, format customization, communication frequency adjustment, and stakeholder-specific messaging approaches. These methods streamline reporting by matching executive summaries for leadership, detailed metrics for project teams, and strategic overviews for clients, with many organizations finding that customized reporting enhances stakeholder engagement and accelerates decision-making processes.
Communicate setbacks by providing clear context, specific corrective actions, and realistic timelines for resolution, while emphasizing your team's proactive response and contingency planning. Frame challenges as manageable issues with defined solutions, include what lessons learned will prevent recurrence, and maintain transparency about impacts while demonstrating control, ultimately building stakeholder confidence through honest, solution-focused communication.
Storytelling transforms status reports by weaving data into compelling narratives that highlight project journeys, challenges overcome, and milestones achieved, making complex information more digestible and memorable. Through narrative techniques, project managers create emotional connections with stakeholders, while contextualizing metrics within broader business objectives, ultimately delivering enhanced engagement and clearer understanding of project impact across organizations.
Charts and graphs enhance status report effectiveness by transforming complex data into visual insights through bar charts for comparisons, line graphs for trends, pie charts for proportions, and dashboards for real-time metrics. These visual tools enable stakeholders to quickly identify performance gaps, track project milestones, and make data-driven decisions, with many organizations finding that visual reporting reduces meeting times while improving strategic alignment and accountability.
Status reports should include executive summary, key accomplishments, current challenges, upcoming milestones, and resource needs in consistent sections. This structured approach enables stakeholders to quickly locate relevant information, with many project managers finding that standardized templates, bullet points, and traffic light indicators streamline communication while maintaining comprehensive coverage of critical project elements.
Feedback from previous status reports enhances future reporting by identifying communication gaps, highlighting preferred detail levels, and revealing stakeholder information needs. Organizations leverage this input to streamline report formats, focus on high-impact metrics, and adjust frequency accordingly, with many project teams finding that iterative refinements ultimately deliver more targeted communication and improved stakeholder engagement.
Ethical considerations include ensuring data accuracy, avoiding misleading visualizations, providing complete context, protecting confidential information, and maintaining transparency about limitations or uncertainties. Organizations presenting financial performance, project outcomes, or operational metrics must balance stakeholder expectations with honest reporting, ultimately delivering trustworthy insights that enable informed decision-making and preserve credibility.
Status reports serve as valuable planning tools by providing historical data trends, resource utilization patterns, milestone completion rates, and performance metrics that inform future project timelines and resource allocation. Through systematic tracking of progress against objectives, organizations can identify recurring bottlenecks, predict potential delays, and adjust strategic forecasts, ultimately enabling more accurate project planning and enhanced operational efficiency across teams.
Creative status report formats include interactive dashboards, visual storytelling with infographics, video updates, gamified progress trackers, and collaborative digital boards. These formats enhance engagement by transforming traditional text-heavy reports into dynamic experiences, with many teams finding that visual and interactive elements significantly improve information retention and team participation.
-
Love the template collection they have! I have prepared for my meetings much faster without worrying about designing a whole presentation from scratch.
-
Appreciate the research and its presentable format.