


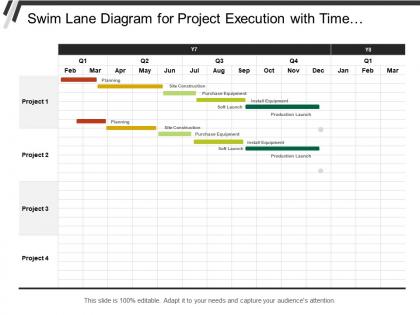
Swim lane diagram for project execution with time duration of each phase




Try Before you Buy Download Free Sample Product
 Impress Your
 Audience
 100%
100% Editable
 Save Hours
 of Time


Experience the extraordinary benefits our Swim Lane Diagram For Project Execution With Time Duration Of Each Phase bring. You will find them absolutely delightful.
People who downloaded this PowerPoint presentation also viewed the following :
Swim lane diagram for project execution with time duration of each phase with all 5 slides:
Our Swim Lane Diagram For Project Execution With Time Duration Of Each Phase allow only the best. They are driven by a culture of excellence.
FAQs for Swim lane diagram for project execution with time duration
A Swim Lane Diagram is a specialized flowchart that organizes process steps across horizontal or vertical lanes, with each lane representing different departments, roles, or systems responsible for specific activities. Unlike traditional flowcharts that focus solely on process flow, swim lane diagrams emphasize accountability and cross-functional collaboration by clearly delineating who performs each task, ultimately delivering enhanced transparency and streamlined communication across organizational boundaries.
Swim Lane Diagrams consist of lanes representing different actors or departments, process steps showing sequential activities, connectors indicating flow direction, decision points for branching paths, and start/end symbols defining boundaries. These components function by organizing complex workflows across multiple stakeholders, enabling teams to identify bottlenecks, clarify responsibilities, and streamline cross-functional processes, ultimately delivering improved operational efficiency and enhanced collaboration.
Swim Lane Diagrams are most effectively utilized when managing cross-functional projects involving multiple departments, complex approval processes, customer service workflows, software development cycles, and compliance-heavy operations. These visual tools streamline project coordination by clearly defining roles, eliminating confusion about handoffs, and identifying bottlenecks, with many project managers finding that they significantly enhance accountability and reduce delays in collaborative environments.
Swim Lane Diagrams enhance team collaboration by clearly defining roles, responsibilities, and handoff points across departments, eliminating confusion about task ownership and process flow. Through visual clarity, teams streamline communication, reduce delays, and minimize errors, with organizations in manufacturing, healthcare, and financial services finding that these diagrams ultimately deliver improved accountability and faster project completion.
Best practices for swim lane diagrams include defining clear roles and responsibilities, using consistent symbols and terminology, maintaining logical flow direction, and ensuring adequate spacing between lanes. These design principles streamline process visualization by eliminating ambiguity, reducing miscommunication, and enhancing cross-functional understanding, with many organizations finding that well-structured swim lanes significantly improve operational efficiency and accountability.
Healthcare organizations use swim lane diagrams for patient care workflows, financial services for loan processing and compliance procedures, manufacturing for quality control processes, and software development for deployment pipelines. These industries benefit from the diagrams' ability to clarify role accountability, eliminate bottlenecks, and streamline cross-departmental coordination, ultimately delivering faster services and enhanced operational efficiency.
Swim Lane Diagrams facilitate process mapping by organizing workflows across functional boundaries, clearly defining roles and responsibilities, identifying handoffs between departments, and highlighting potential bottlenecks or inefficiencies. These visual tools streamline documentation efforts by creating standardized process maps that teams can easily understand and update, with organizations in manufacturing, healthcare, and financial services finding that swim lanes significantly reduce miscommunication and accelerate process optimization initiatives.
Recommended software tools for creating Swim Lane Diagrams include Microsoft Visio, Lucidchart, Draw.io, Creately, and SmartDraw, each offering specialized templates and collaboration features. These platforms streamline diagram creation by providing drag-and-drop functionality, real-time collaboration, and integration capabilities, with many organizations finding that cloud-based solutions like Lucidchart enhance team coordination and process documentation efficiency.
Swim Lane Diagrams adapt to remote teams through cloud-based diagramming tools, real-time collaborative editing, and integrated communication features that enable distributed stakeholders to visualize workflows seamlessly. Virtual platforms allow team members across different locations to simultaneously update processes, assign responsibilities, and track progress while maintaining clear accountability, ultimately delivering enhanced transparency and streamlined coordination in increasingly remote work environments.
Common challenges include unclear role boundaries, process complexity overload, maintenance difficulties, and stakeholder resistance to change. However, these can be addressed through regular stakeholder reviews, phased diagram development, and clear ownership assignments, with many organizations finding that structured training sessions and collaborative mapping workshops ultimately enhance team alignment and process transparency across departments.
Swim Lane Diagrams reveal bottlenecks by visualizing where tasks accumulate within specific departments, identifying handoff delays between teams, and highlighting resource constraints or approval cycles that slow progress. Through clear lane separation, organizations can pinpoint inefficiencies like overburdened departments or redundant steps, ultimately enabling targeted process improvements that streamline operations and enhance overall workflow efficiency.
Swim Lane Diagrams integrate within Agile methodologies by mapping cross-functional responsibilities during sprint planning, visualizing handoffs between development teams, and clarifying accountability for user stories across iterations. These diagrams streamline Agile ceremonies by defining role boundaries, reducing workflow bottlenecks, and enhancing team collaboration, with many organizations finding that clear process visualization accelerates sprint delivery and improves stakeholder communication.
Color coding and visual elements significantly enhance Swim Lane Diagrams by improving clarity, reducing interpretation time, and enabling faster decision-making across complex workflows. These visual techniques streamline process identification, highlight bottlenecks and dependencies, and facilitate better communication between departments, with many organizations finding that strategic color schemes ultimately deliver enhanced operational efficiency and clearer accountability structures.
Swim Lane Diagrams integrate seamlessly with Six Sigma methodologies by providing clear process visualization during the Define and Measure phases, helping identify waste, bottlenecks, and handoff inefficiencies across departmental boundaries. This strategic combination enables organizations to streamline cross-functional workflows, reduce cycle times, and enhance accountability, with many manufacturing and financial services companies finding that visual process mapping accelerates their DMAIC improvement initiatives significantly.
Common misconceptions include believing swim lane diagrams are only for complex processes, that they're too time-consuming to create, that they're purely IT tools, and that they can't handle cross-functional workflows effectively. However, these visual mapping tools streamline process documentation across industries like healthcare, manufacturing, and financial services, with many organizations finding that they actually reduce confusion, accelerate training, and enhance operational transparency.
-
Good research work and creative work done on every template.
-
Helpful product design for delivering presentation.