Powerpoint Templates and Google slides for Asia Pacific
Save Your Time and attract your audience with our fully editable PPT Templates and Slides.
-
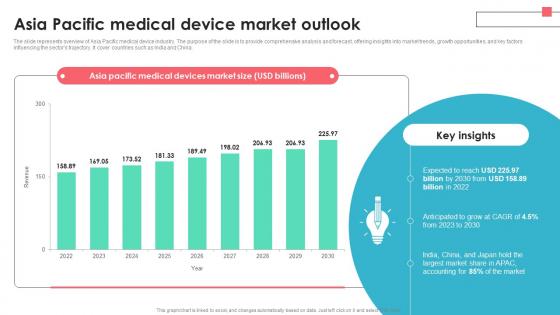 Asia Pacific Medical Device Market Medical Device Industry Report IR SS
The slide represents overview of Asia Pacific medical device industry. The purpose of the slide is to provide comprehensive analysis and forecast, offering insights into market trends, growth opportunities, and key factors influencing the sectors trajectory. It cover countries such as India and China. Present the topic in a bit more detail with this Asia Pacific Medical Device Market Medical Device Industry Report IR SS. Use it as a tool for discussion and navigation on Asia Pacific, Medical Devices, Market Size. This template is free to edit as deemed fit for your organization. Therefore download it now.
-
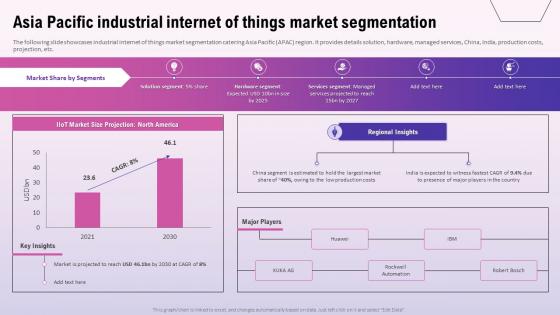 Exploring The Opportunities In The Global Asia Pacific Industrial Internet Of Things Market
The following slide showcases industrial internet of things market segmentation catering Asia Pacific APAC region. It provides details solution, hardware, managed services, China, India, production costs, projection, etc. Deliver an outstanding presentation on the topic using this Exploring The Opportunities In The Global Asia Pacific Industrial Internet Of Things Market. Dispense information and present a thorough explanation of Asia Pacific Industrial Internet, Things Market Segmentation, Hardware, Managed Services using the slides given. This template can be altered and personalized to fit your needs. It is also available for immediate download. So grab it now.
-
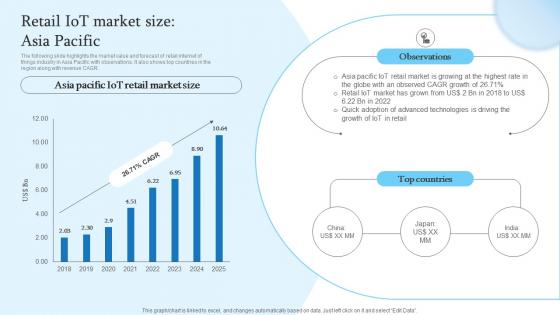 Retail IoT Market Size Asia Pacific Retail Transformation Through IoT
The following slide highlights the market value and forecast of retail internet of things industry in Asia Pacific with observations. It also shows top countries in the region along with revenue CAGR. Deliver an outstanding presentation on the topic using this Retail IoT Market Size Asia Pacific Retail Transformation Through IoT. Dispense information and present a thorough explanation of Retail, Market, Globe using the slides given. This template can be altered and personalized to fit your needs. It is also available for immediate download. So grab it now.
-
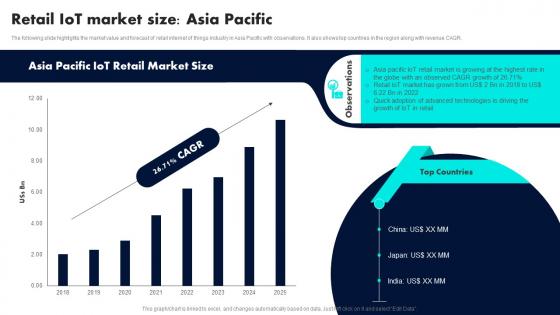 Retail IoT Market Size Asia Pacific Retail Industry Adoption Of IoT Technology
The following slide highlights the market value and forecast of retail internet of things industry in Asia Pacific with observations. It also shows top countries in the region along with revenue CAGR. Deliver an outstanding presentation on the topic using this Retail IoT Market Size Asia Pacific Retail Industry Adoption Of IoT Technology. Dispense information and present a thorough explanation of Asia Pacific IoT, Retail Market Size using the slides given. This template can be altered and personalized to fit your needs. It is also available for immediate download. So grab it now.
-
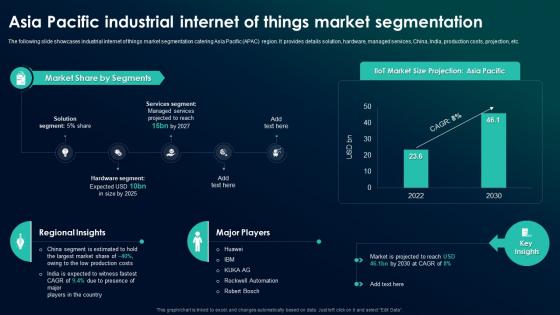 The Future Of Industrial IoT Asia Pacific Industrial Internet Of Things Market Segmentation
The following slide showcases industrial internet of things market segmentation catering Asia Pacific APAC region. It provides details solution, hardware, managed services, China, India, production costs, projection, etc. Present the topic in a bit more detail with this The Future Of Industrial IoT Asia Pacific Industrial Internet Of Things Market Segmentation. Use it as a tool for discussion and navigation on Industrial Internet Of Things, Market Segmentation, Managed Services. This template is free to edit as deemed fit for your organization. Therefore download it now.
-
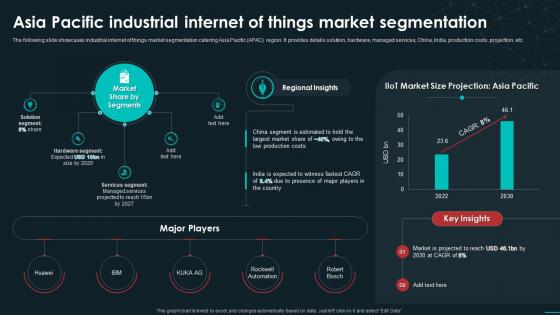 Asia Pacific Industrial Internet Of Things Market Unveiling The Global Industrial IoT Landscape
The following slide showcases industrial internet of things market segmentation catering Asia Pacific APAC region. It provides details solution, hardware, managed services, China, India, production costs, projection, etc. Present the topic in a bit more detail with this Asia Pacific Industrial Internet Of Things Market Unveiling The Global Industrial IoT Landscape. Use it as a tool for discussion and navigation on Asia Pacific, Industrial Internet Of Things, Market Segmentation, Production Costs. This template is free to edit as deemed fit for your organization. Therefore download it now.
-
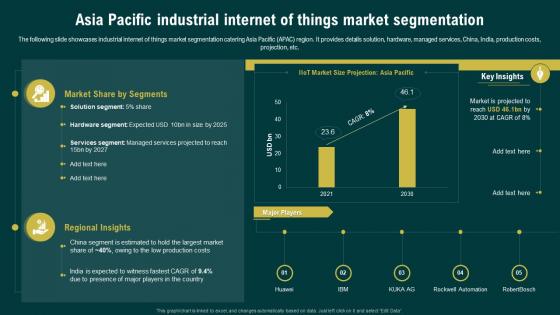 Asia Pacific Industrial Internet Of Things Market Segmentation Navigating The Industrial IoT
The following slide showcases industrial internet of things market segmentation catering Asia Pacific APAC region. It provides details solution, hardware, managed services, China, India, production costs, projection, etc. Present the topic in a bit more detail with this Asia Pacific Industrial Internet Of Things Market Segmentation Navigating The Industrial IoT. Use it as a tool for discussion and navigation on Industrial Internet Of Things, Market Segmentation, Catering Asia Pacific Region, Managed Services, Production Costs, Projection. This template is free to edit as deemed fit for your organization. Therefore download it now.
-
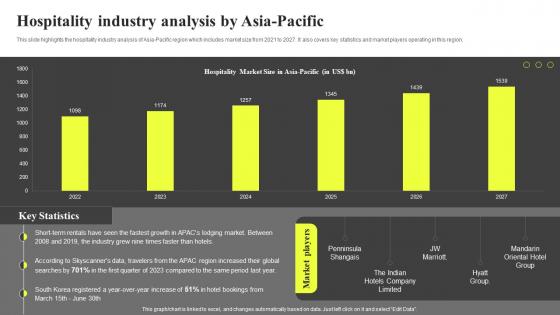 Hospitality Industry Analysis By Asia Pacific Hospitality Industry Report IR SS
This slide highlights the hospitality industry analysis of Asia-Pacific region which includes market size from 2021 to 2027. It also covers key statistics and market players operating in this region.Present the topic in a bit more detail with this Hospitality Industry Analysis By Asia Pacific Hospitality Industry Report IR SS. Use it as a tool for discussion and navigation on Region Increased, South Korea Registered, Hospitality Market. This template is free to edit as deemed fit for your organization. Therefore download it now.
-
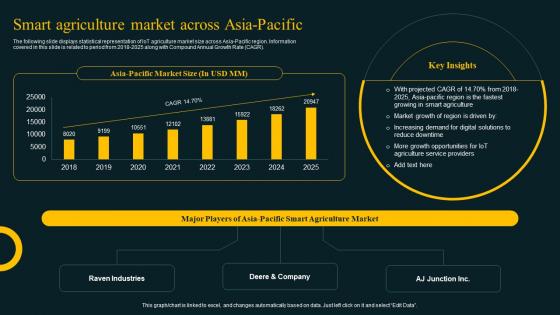 Smart Agriculture Market Across Asia Pacific Improving Agricultural IoT SS
The following slide displays statistical representation of IoT agriculture market size across Asia Pacific region. Information covered in this slide is related to period from 2018 2025 along with Compound Annual Growth Rate CAGR. Deliver an outstanding presentation on the topic using this Smart Agriculture Market Across Asia Pacific Improving Agricultural IoT SS. Dispense information and present a thorough explanation of Asia Pacific Market, Raven Industries using the slides given. This template can be altered and personalized to fit your needs. It is also available for immediate download. So grab it now.
-
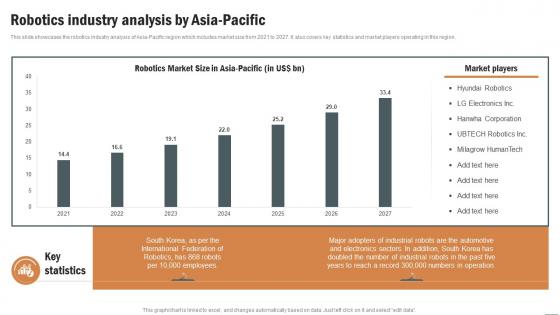 Robotics Industry Analysis By Asia Pacific Robotics Industry Report IR SS
This slide showcases the robotics industry analysis of Asia Pacific region which includes market size from 2021 to 2027. It also covers key statistics and market players operating in this region. Present the topic in a bit more detail with this Robotics Industry Analysis By Asia Pacific Robotics Industry Report IR SS. Use it as a tool for discussion and navigation on Major Adopters, Electronics Sectors, Hyundai Robotics. This template is free to edit as deemed fit for your organization. Therefore download it now.
-
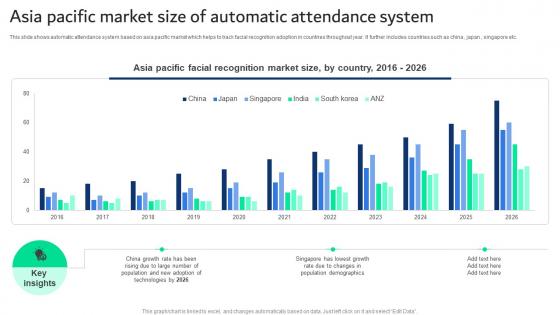 Asia Pacific Market Size Of Automatic Attendance System
This slide shows automatic attendance system based on asia pacific market which helps to track facial recognition adoption in countries throughout year. It further includes countries such as china ,japan ,singapore etc. Introducing our Asia Pacific Market Size Of Automatic Attendance System set of slides. The topics discussed in these slides are Asia Pacific, Facial Recognition, Market Size This is an immediately available PowerPoint presentation that can be conveniently customized. Download it and convince your audience.
-
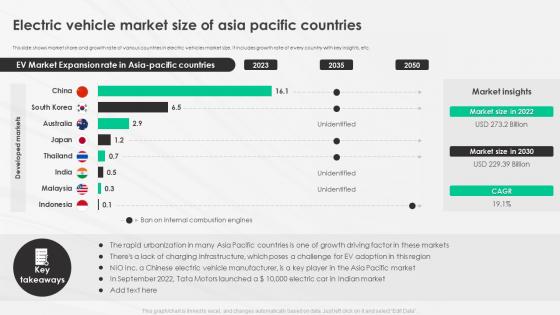 Era Electric Vehicle Market Size Of Asia Pacific Countries A Complete Guide To Electric Vehicle
This slide shows market share and growth rate of various countries in electric vehicles market size. It includes growth rate of every country with key insights, etc. Present the topic in a bit more detail with this Era Electric Vehicle Market Size Of Asia Pacific Countries A Complete Guide To Electric Vehicle. Use it as a tool for discussion and navigation on Market Share And Growth Rate, Electric Vehicles Market Size, Rapid Urbanization. This template is free to edit as deemed fit for your organization. Therefore download it now.
-
 Asia Pacific Tobacco Market Overview Global Tobacco Industry Outlook Industry IR SS
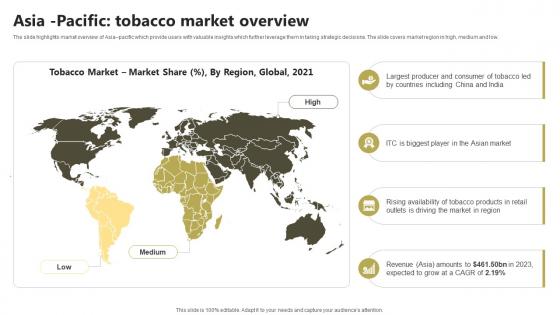
The slide highlights market overview of Asia pacific which provide users with valuable insights which further leverage them in taking strategic decisions. The slide covers market region in high, medium and low. Increase audience engagement and knowledge by dispensing information using Asia Pacific Tobacco Market Overview Global Tobacco Industry Outlook Industry IR SS. This template helps you present information on four stages. You can also present information on Producer, Availability, Market using this PPT design. This layout is completely editable so personaize it now to meet your audiences expectations.
-
 Digital Transformation In Banking Across Asia Pacific Digital Transformation In Banking DT SS
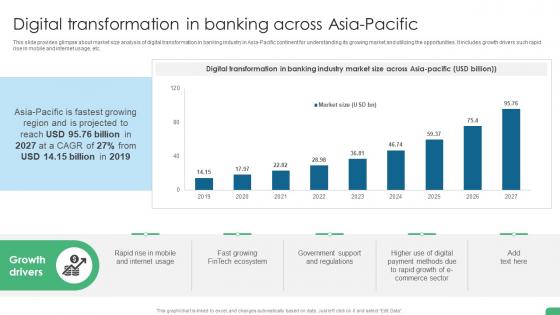
This slide provides glimpse about market size analysis of digital transformation in banking industry in Asia-Pacific continent for understanding its growing market and utilizing the opportunities. It includes growth drivers such rapid rise in mobile and internet usage, etc. Present the topic in a bit more detail with this Digital Transformation In Banking Across Asia Pacific Digital Transformation In Banking DT SS Use it as a tool for discussion and navigation on Digital Transformation, Banking Industry, Market Size This template is free to edit as deemed fit for your organization. Therefore download it now.
-
 Puma Company Profile Business Segment Asia Pacific Without Greater China Ppt Guidelines CP SS
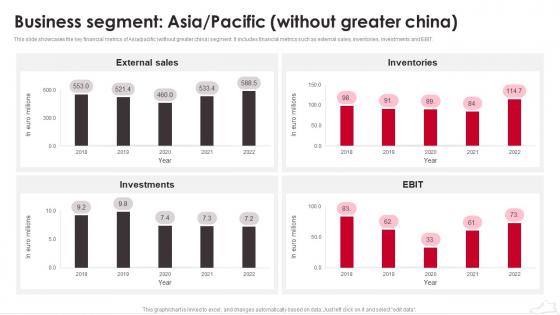
This slide showcases the key financial metrics of Asiapacific without greater china segment. It includes financial metrics such as external sales, inventories, investments and EBIT. Deliver an outstanding presentation on the topic using this Puma Company Profile Business Segment Asia Pacific Without Greater China Ppt Guidelines CP SS. Dispense information and present a thorough explanation of Puma Company Profile, Business Segment Asia using the slides given. This template can be altered and personalized to fit your needs. It is also available for immediate download. So grab it now.
-
 Asia Pacific Retail IoT Market Highlights And Trends Retail Transformation Through IoT
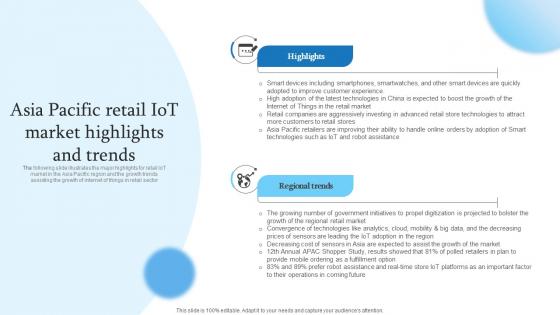
The following slide illustrates the major highlights for retail IoT market in the Asia Pacific region and the growth trends assisting the growth of internet of things in retail sector Introducing Asia Pacific Retail IoT Market Highlights And Trends Retail Transformation Through IoT to increase your presentation threshold. Encompassed with two stages, this template is a great option to educate and entice your audience. Dispence information on Improve, Experience, Technologies, using this template. Grab it now to reap its full benefits.
-
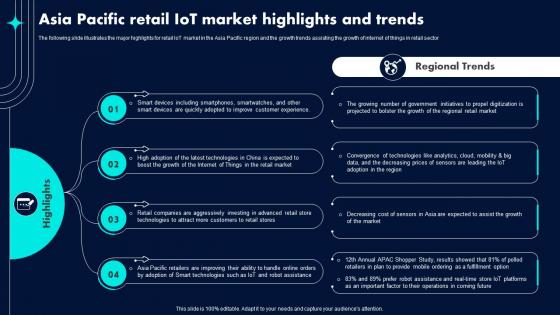 Asia Pacific Retail IoT Market Highlights Retail Industry Adoption Of IoT Technology
The following slide illustrates the major highlights for retail IoT market in the Asia Pacific region and the growth trends assisting the growth of internet of things in retail sector Introducing Asia Pacific Retail IoT Market Highlights Retail Industry Adoption Of IoT Technology to increase your presentation threshold. Encompassed with Four stages, this template is a great option to educate and entice your audience. Dispence information on Improve Customer Experience, Retail Market, Retail Stores, using this template. Grab it now to reap its full benefits.
-
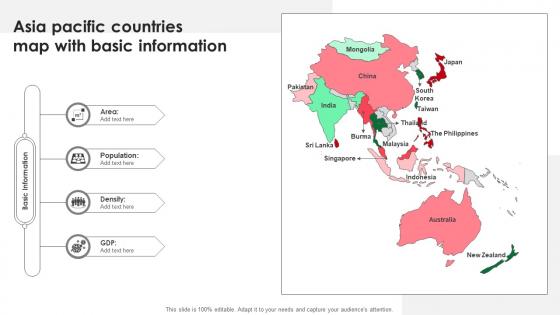 Asia Pacific Countries Map With Basic Information
Presenting our set of slides with Asia Pacific Countries Map With Basic Information. This exhibits information on four stages of the process. This is an easy to edit and innovatively designed PowerPoint template. So download immediately and highlight information on Area, Population, Density.
-
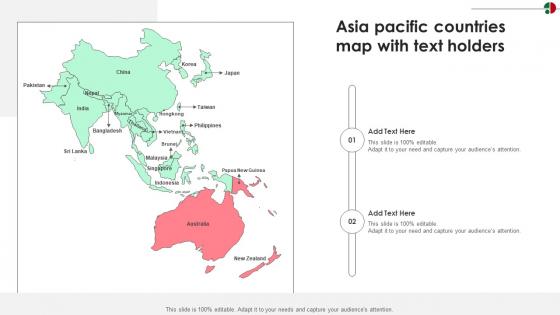 Asia Pacific Countries Map With Text Holders
Introducing our premium set of slides with Asia Pacific Countries Map With Text Holders. Ellicudate the three stages and present information using this PPT slide. This is a completely adaptable PowerPoint template design that can be used to interpret topics like Asia Pacific Countries Map, Text Holders. So download instantly and tailor it with your information.
-
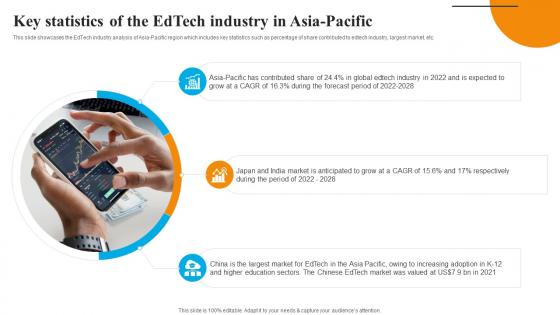 Global Edtech Industry Outlook Key Statistics Of The Edtech Industry In Asia Pacific IR SS
This slide showcases the EdTech industry analysis of Asia-Pacific region which includes key statistics such as percentage of share contributed to edtech industry, largest market, etc. Increase audience engagement and knowledge by dispensing information using Global Edtech Industry Outlook Key Statistics Of The Edtech Industry In Asia Pacific IR SS. This template helps you present information on three stages. You can also present information on Edtech Industry Analysis, Asia Pacific Region, Edtech Industry, Higher Education Sectors using this PPT design. This layout is completely editable so personaize it now to meet your audiences expectations.
-
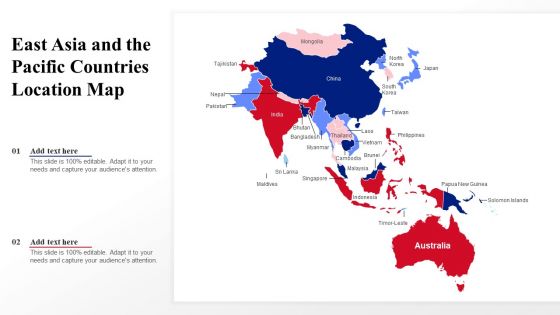 East Asia And The Pacific Countries Location Map
Presenting our set of slides with East Asia And The Pacific Countries Location Map. This exhibits information on One stages of the process. This is an easy to edit and innovatively designed PowerPoint template. So download immediately and highlight information on Location Map, Change In Net Wealth By Country.
-
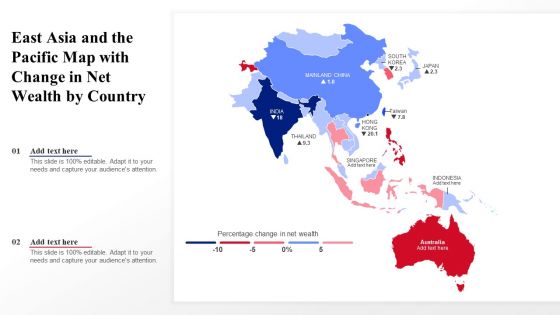 East Asia And The Pacific Map With Change In Net Wealth By Country
Introducing our premium set of slides with East Asia And The Pacific Map With Change In Net Wealth By Country. Ellicudate the One stages and present information using this PPT slide. This is a completely adaptable PowerPoint template design that can be used to interpret topics like Location Map, Change In Net Wealth By Country. So download instantly and tailor it with your information.
-
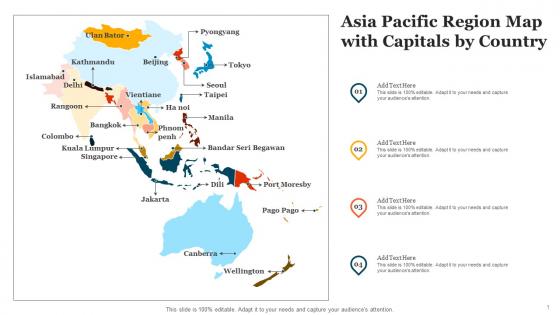 Asia Pacific Region Map With Capitals By Country
Presenting our set of slides with Asia Pacific Region Map With Capitals By Country. This exhibits information on four stages of the process. This is an easy to edit and innovatively designed PowerPoint template. So download immediately and highlight information on Capitals By Country, Text Holders.
-
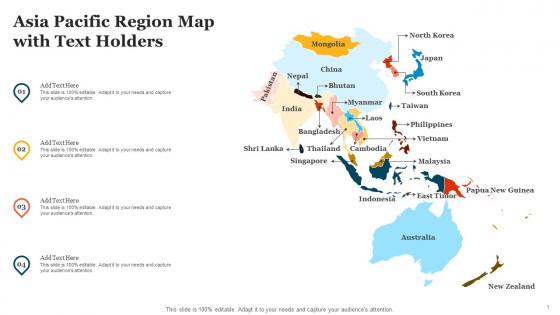 Asia Pacific Region Map With Text Holders
Introducing our premium set of slides with Asia Pacific Region Map With Text Holders. Ellicudate the four stages and present information using this PPT slide. This is a completely adaptable PowerPoint template design that can be used to interpret topics like Capitals By Country, Text Holders. So download instantly and tailor it with your information.
-
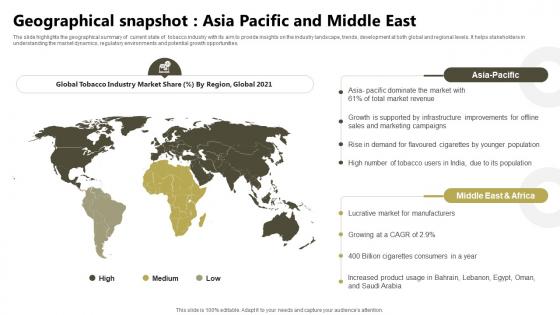 Geographical Snapshot Asia Pacific And Global Tobacco Industry Outlook Industry IR SS
The slide highlights the geographical summary of current state of tobacco industry with its aim to provide insights on the industry landscape, trends, development at both global and regional levels. It helps stakeholders in understanding the market dynamics, regulatory environments and potential growth opportunities. Introducing Geographical Snapshot Asia Pacific And Global Tobacco Industry Outlook Industry IR SS to increase your presentation threshold. Encompassed with two stages, this template is a great option to educate and entice your audience. Dispence information on Growth, Marketing, Flavoured, using this template. Grab it now to reap its full benefits.
-
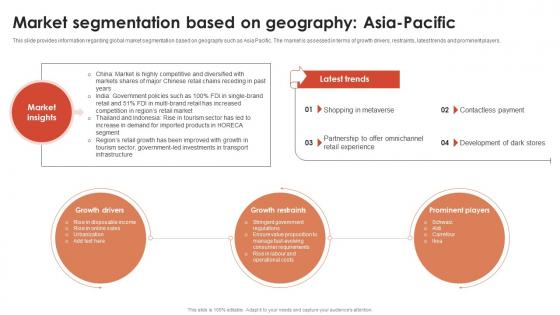 Market Segmentation Based On Geography Asia Pacific Global Retail Industry Analysis IR SS
This slide provides information regarding global market segmentation based on geography such as Asia Pacific. The market is assessed in terms of growth drivers, restraints, latest trends and prominent players. Increase audience engagement and knowledge by dispensing information using Market Segmentation Based On Geography Asia Pacific Global Retail Industry Analysis IR SS. This template helps you present information on three stages. You can also present information on Contactless Payment, Development Of Dark Stores, Shopping In Metaverse, Omnichannel Retail Experience using this PPT design. This layout is completely editable so personaize it now to meet your audiences expectations.
-
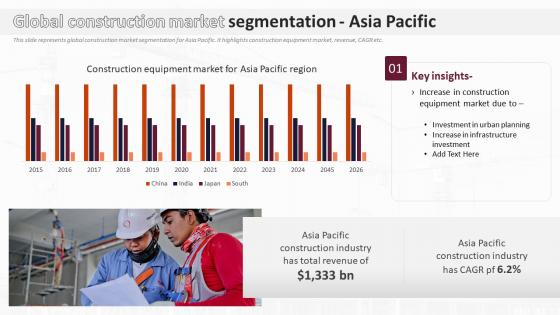 Global Construction Market Segmentation Asia Pacific Analysis Of Global Construction Industry
This slide represents global construction market segmentation for Asia Pacific. It highlights construction equipment market, revenue, CAGR etc. Deliver an outstanding presentation on the topic using this Global Construction Market Segmentation Asia Pacific Analysis Of Global Construction Industry. Dispense information and present a thorough explanation of Investment In Urban Planning, Increase In Infrastructure Investment, Construction Industry using the slides given. This template can be altered and personalized to fit your needs. It is also available for immediate download. So grab it now.
-
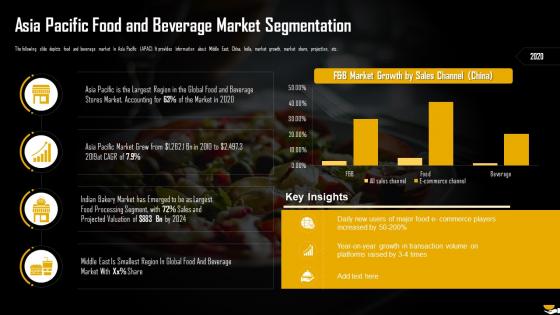 Asia Pacific Food And Beverage Market Segmentation Analysis Of Global Food And Beverage
The following slide depicts food and beverage market in Asia Pacific APAC . It provides information about Middle East, China, India, market growth, market share, projection, etc. Present the topic in a bit more detail with this Asia Pacific Food And Beverage Market Segmentation Analysis Of Global Food And Beverage. Use it as a tool for discussion and navigation on Global Food And Beverage Stores Market, Asia Pacific Market Grew, Largest Food Processing Segment. This template is free to edit as deemed fit for your organization. Therefore download it now.
-
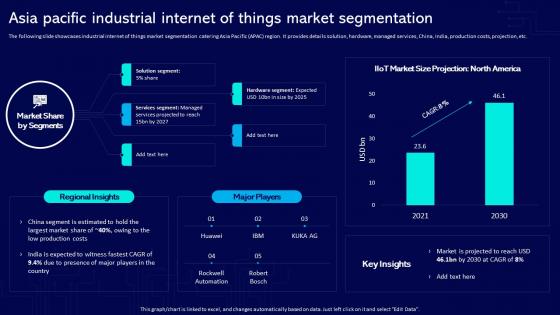 Global Industrial Internet Asia Pacific Industrial Internet Of Things Market Segmentation
The following slide showcases industrial internet of things market segmentation catering Asia Pacific APAC region. It provides details solution, hardware, managed services, China, India, production costs, projection, etc. Deliver an outstanding presentation on the topic using this Global Industrial Internet Asia Pacific Industrial Internet Of Things Market Segmentation. Dispense information and present a thorough explanation of Asia Pacific, Industrial Internet, Market Segmentation using the slides given. This template can be altered and personalized to fit your needs. It is also available for immediate download. So grab it now.
-
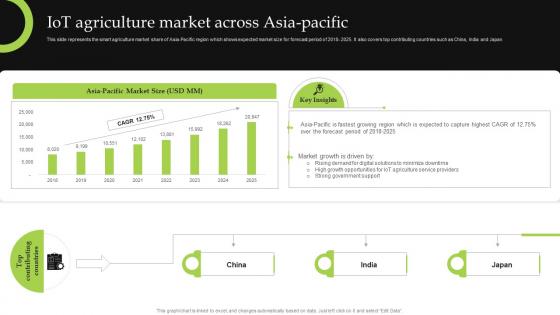 F1094 Iot Agriculture Market Across Asia Pacific Iot Implementation For Smart Agriculture And Farming
This slide represents the smart agriculture market share of Asia-Pacific region which shows expected market size for forecast period of 2018- 2025. It also covers top contributing countries such as China, India and Japan Present the topic in a bit more detail with this F1094 Iot Agriculture Market Across Asia Pacific Iot Implementation For Smart Agriculture And Farming. Use it as a tool for discussion and navigation on Growth, Opportunities, Service. This template is free to edit as deemed fit for your organization. Therefore download it now.
-
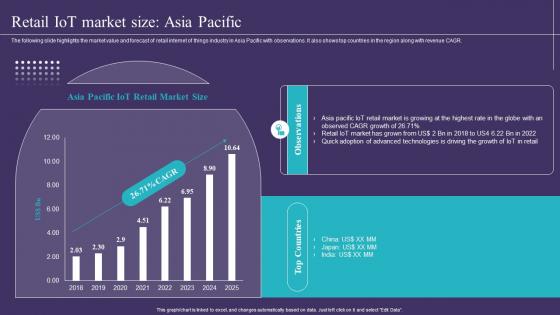 Retail IoT Market Size Asia Pacific IoT Implementation In Retail Market Ppt Infographic Template Show
The following slide highlights the market value and forecast of retail internet of things industry in Asia Pacific with observations. It also shows top countries in the region along with revenue CAGR. Deliver an outstanding presentation on the topic using this Retail IoT Market Size Asia Pacific IoT Implementation In Retail Market Ppt Infographic Template Show. Dispense information and present a thorough explanation of Retail IoT Market Size, Advanced Technologies, IoT Retail Market Is Growing using the slides given. This template can be altered and personalized to fit your needs. It is also available for immediate download. So grab it now.
-
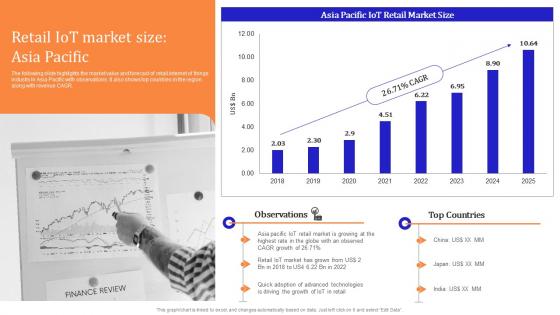 Iot Enabled Retail Market Operations Retail Iot Market Size Asia Pacific
The following slide highlights the market value and forecast of retail internet of things industry in Asia Pacific with observations. It also shows top countries in the region along with revenue CAGR. Present the topic in a bit more detail with this Iot Enabled Retail Market Operations Retail Iot Market Size Asia Pacific. Use it as a tool for discussion and navigation on CAGR Growth, Technologies, Retail. This template is free to edit as deemed fit for your organization. Therefore download it now.
-
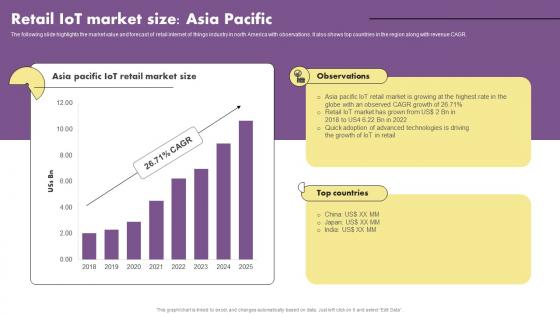 Retail Iot Market Size Asia Pacific The Future Of Retail With Iot
The following slide highlights the market value and forecast of retail internet of things industry in north America with observations. It also shows top countries in the region along with revenue CAGR. Present the topic in a bit more detail with this Retail Iot Market Size Asia Pacific The Future Of Retail With Iot. Use it as a tool for discussion and navigation on Growth, Globe, Iot Retail Market. This template is free to edit as deemed fit for your organization. Therefore download it now.
-
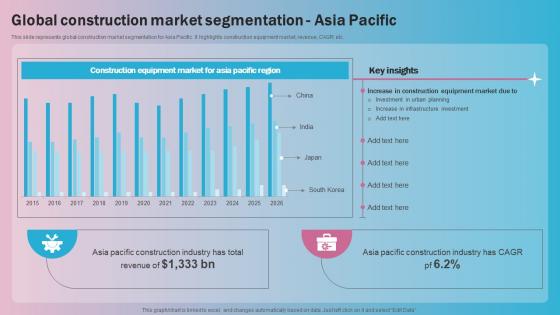 Global Construction Market Segmentation Asia Pacific
This slide represents global construction market segmentation for Asia Pacific. It highlights construction equipment market, revenue, CAGR etc. Present the topic in a bit more detail with this Global Construction Market Segmentation Asia Pacific. Use it as a tool for discussion and navigation on Construction Equipment, Market For Asia, Pacific Region This template is free to edit as deemed fit for your organization. Therefore download it now.
-
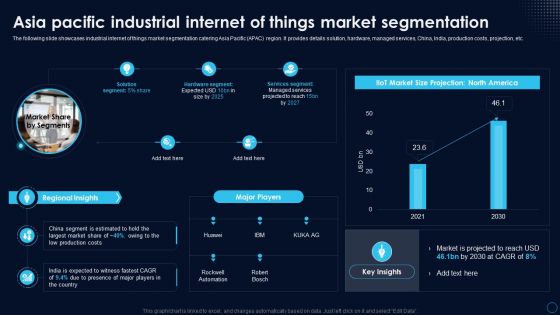 Global Industrial Internet Of Things Asia Pacific Industrial Internet Of Things Market Segmentation
The following slide showcases industrial internet of things market segmentation catering Asia Pacific APAC region. It provides details solution, hardware, managed services, China, India, production costs, projection, etc. Deliver an outstanding presentation on the topic using this Global Industrial Internet Of Things Asia Pacific Industrial Internet Of Things Market Segmentation. Dispense information and present a thorough explanation of Industrial Internet Of Things, Market Segmentation, Catering Asia Pacific Region, Managed Services, Production Costs using the slides given. This template can be altered and personalized to fit your needs. It is also available for immediate download. So grab it now.
-
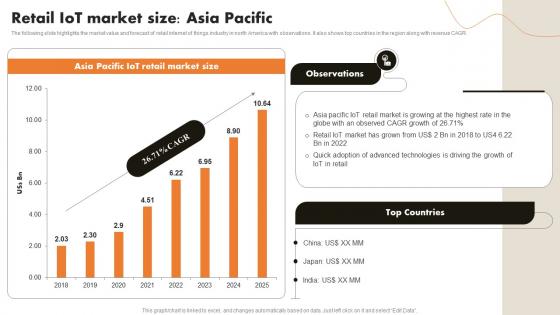 Retail IoT Market Size Asia Pacific IoT Retail Market Analysis And Implementation
The following slide highlights the market value and forecast of retail internet of things industry in north America with observations. It also shows top countries in the region along with revenue CAGR. Present the topic in a bit more detail with this Retail IoT Market Size Asia Pacific IoT Retail Market Analysis And Implementation. Use it as a tool for discussion and navigation on Asia Pacific, IoT Retail Market Size, Observations. This template is free to edit as deemed fit for your organization. Therefore download it now.
-
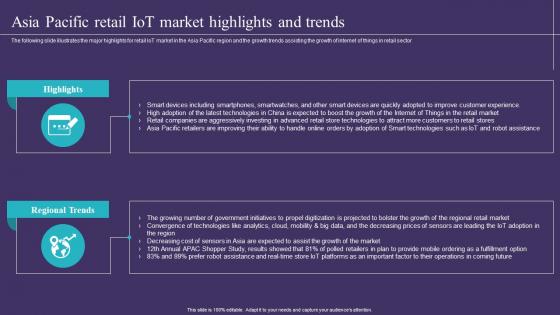 Asia Pacific Retail IoT Market Highlights And Trends IoT Implementation In Retail Market
The following slide illustrates the major highlights for retail IoT market in the Asia Pacific region and the growth trends assisting the growth of internet of things in retail sector. Increase audience engagement and knowledge by dispensing information using Asia Pacific Retail IoT Market Highlights And Trends IoT Implementation In Retail Market. This template helps you present information on two stages. You can also present information on Asia Pacific, Retail IoT, Market Highlights, Trends using this PPT design. This layout is completely editable so personaize it now to meet your audiences expectations.
-
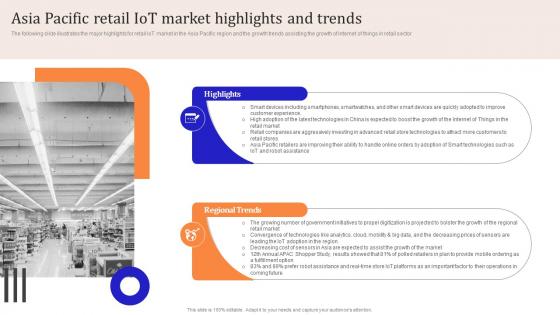 Iot Enabled Retail Market Operations Asia Pacific Retail Iot Market Highlights
Present the topic in a bit more detail with this Iot Enabled Retail Market Operations Asia Pacific Retail Iot Market Highlights. Use it as a tool for discussion and navigation on Technologies, Customers, Retail Market. This template is free to edit as deemed fit for your organization. Therefore download it now.
-
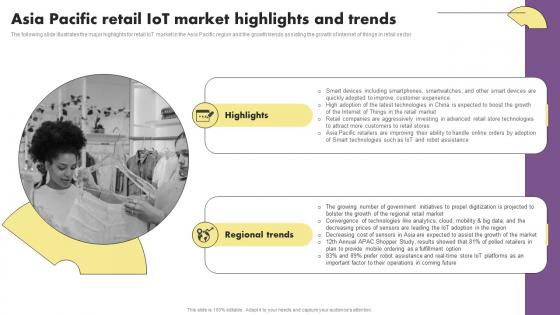 The Future Of Retail With Iot Asia Pacific Retail Iot Market Highlights And Trends
The following slide illustrates the major highlights for retail IoT market in the Asia Pacific region and the growth trends assisting the growth of internet of things in retail sector. Present the topic in a bit more detail with this The Future Of Retail With Iot Asia Pacific Retail Iot Market Highlights And Trends. Use it as a tool for discussion and navigation on Growth, Internet Of Things, Technologies. This template is free to edit as deemed fit for your organization. Therefore download it now.
-
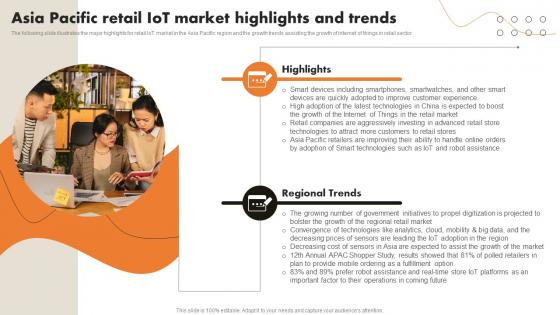 Asia Pacific Retail IoT Market Highlights And Trends IoT Retail Market Analysis And Implementation
The following slide illustrates the major highlights for retail IoT market in the Asia Pacific region and the growth trends assisting the growth of internet of things in retail sector. Introducing Asia Pacific Retail IoT Market Highlights And Trends IoT Retail Market Analysis And Implementation to increase your presentation threshold. Encompassed with two stages, this template is a great option to educate and entice your audience. Dispence information on Highlights, Regional Trends, Customer Experience, using this template. Grab it now to reap its full benefits.
-
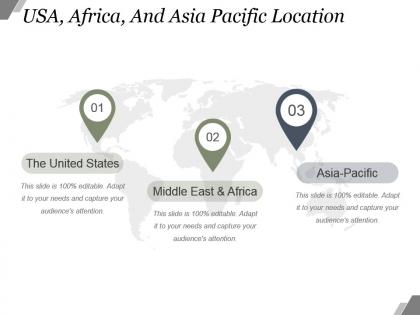 Usa africa and asia pacific location powerpoint slide presentation guidelines
Presenting usa africa and asia pacific location powerpoint slide presentation guidelines. This is a usa africa and asia pacific location powerpoint slide presentation guidelines. This is a three stage process. The stages in this process are the united states, middle east and africa, asia pacific.
-
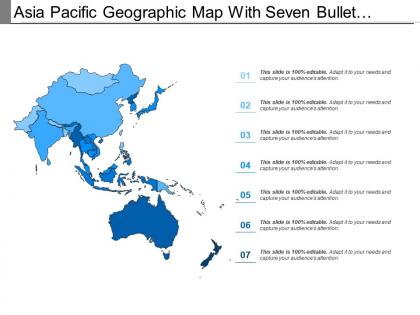 Asia pacific geographic map with seven bullet points
Presenting this set of slides with name - Asia Pacific Geographic Map With Seven Bullet Points. This is a one stage process. The stages in this process are Asia Pacific Map, Countries.
-
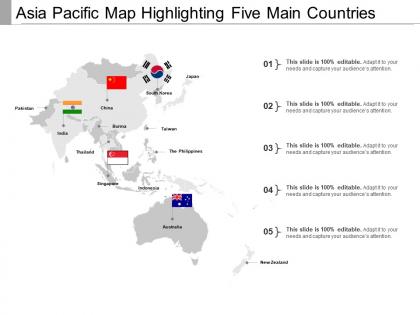 Asia pacific map
Presenting this set of slides with name - Asia Pacific Map. This is a one stage process. The stages in this process are Asia Pacific Map, Countries.
-
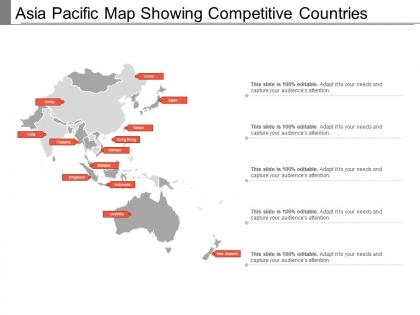 Asia pacific map showing competitive countries
Presenting this set of slides with name - Asia Pacific Map Showing Competitive Countries. This is a one stage process. The stages in this process are Asia Pacific Map, Countries.
-
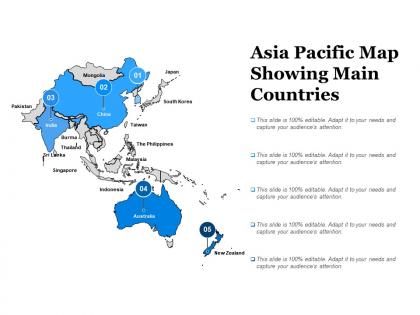 Asia pacific map showing main countries
Presenting this set of slides with name - Asia Pacific Map Showing Main Countries. This is a one stage process. The stages in this process are Asia Pacific Map, Countries.
-
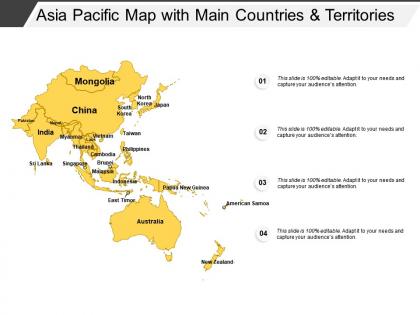 Asia pacific map with main countries and territories
Presenting this set of slides with name - Asia Pacific Map With Main Countries And Territories. This is a one stage process. The stages in this process are Asia Pacific Map, Countries.
-
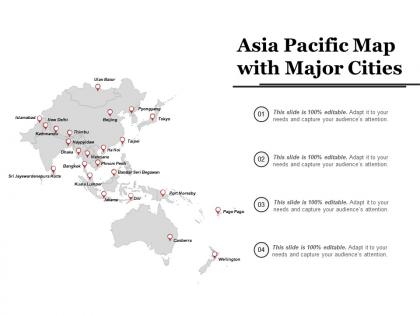 Asia pacific map with major cities
Presenting this set of slides with name - Asia Pacific Map With Major Cities. This is a one stage process. The stages in this process are Asia Pacific Map, Countries.
-
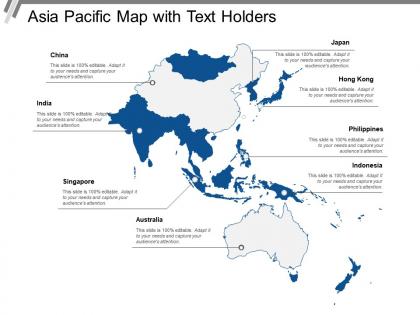 Asia pacific map with text holders
Presenting this set of slides with name - Asia Pacific Map With Text Holders. This is a one stage process. The stages in this process are Asia Pacific Map, Countries.
-
 Map of the asia pacific region with all countries
Presenting this set of slides with name - Map Of The Asia Pacific Region With All Countries. This is a one stage process. The stages in this process are Asia Pacific Map, Countries.
-
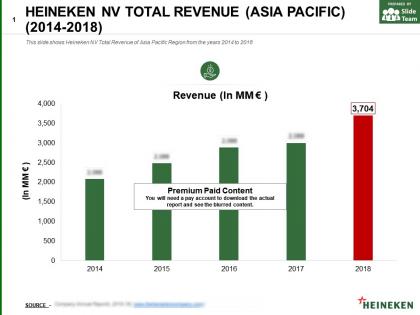 Heineken nv total revenue asia pacific 2014-2018
This is a professionally designed visual chart for Heineken Nv Total Revenue Asia Pacific 2014 to 2018. This is part of our Data and Statistics products selection, and you will need a Paid account to download the actual report with accurate data and sources. Downloaded report will contain the editable graph with accurate data, an excel table with the actual data, the exact source of the data and the release date. This slide shows Heineken NV Total Revenue of Asia Pacific Region from the years 2014 to 2018. Download it immediately and use it for your business.
-
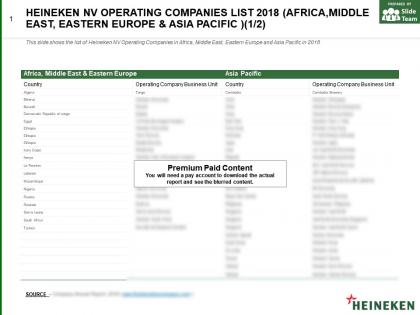 Heineken nv operating companies list 2018 africa middle east eastern europe and asia pacific
The information presented in this slide has been researched by our team of professional business analysts. This is part of our Company Profiles products selection, and you will need a Paid account to download the actual report with accurate data and sources. Downloaded report will be in Powerpoint and will contain the actual editable slides with the actual data and sources for each data. This slide shows the list of Heineken NV Operating Companies in Africa, Middle East, Eastern Europe and Asia Pacific in 2018. Download it immediately and use it for your business.
-
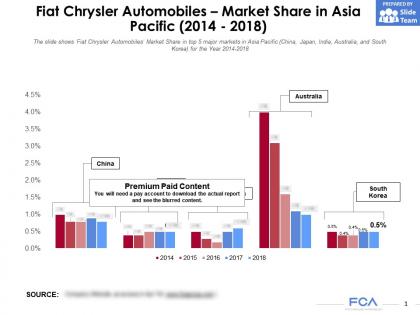 Fiat chrysler automobiles market share in asia pacific 2014-2018
This is a professionally designed visual chart for Fiat Chrysler Automobiles Market Share In Asia Pacific 2014 to 2018. This is part of our Data and Statistics products selection, and you will need a Paid account to download the actual report with accurate data and sources. Downloaded report will contain the editable graph with accurate data, an excel table with the actual data, the exact source of the data and the release date. The slide shows Fiat Chrysler Automobiles Market Share in top 5 major markets in Asia Pacific China, Japan, India, Australia, and South Korea for the Year 2014 to 2018. Download it immediately and use it for your business.
-
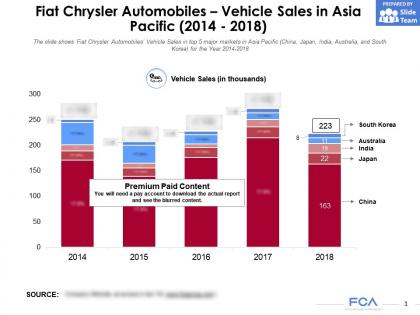 Fiat chrysler automobiles vehicle sales in asia pacific 2014-2018
This is a professionally designed visual chart for Fiat Chrysler Automobiles Vehicle Sales In Asia Pacific 2014 to 2018. This is part of our Data and Statistics products selection, and you will need a Paid account to download the actual report with accurate data and sources. Downloaded report will contain the editable graph with accurate data, an excel table with the actual data, the exact source of the data and the release date. The slide shows Fiat Chrysler Automobiles Vehicle Sales in top 5 major markets in Asia Pacific China, Japan, India, Australia, and South Korea for the Year 2014 to 2018. Download it immediately and use it for your business.
-
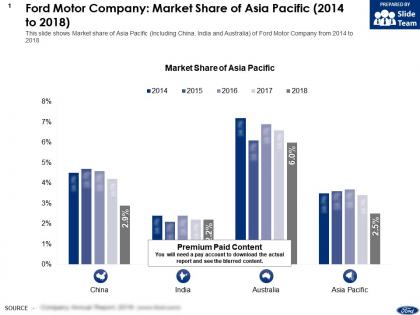 Ford motor company market share of asia pacific 2014-2018
This is a professionally designed visual chart for Ford Motor Company Market Share Of Asia Pacific 2014 to 2018. This is part of our Data and Statistics products selection, and you will need a Paid account to download the actual report with accurate data and sources. Downloaded report will contain the editable graph with accurate data, an excel table with the actual data, the exact source of the data and the release date. This slide shows Market share of Asia Pacific Including China, India and Australia of Ford Motor Company from 2014 to 2018. Download it immediately and use it for your business.
-
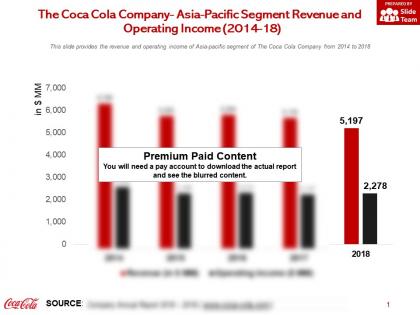 The coca cola company asia pacific segment revenue and operating income 2014-18
This is a professionally designed visual chart for The Coca Cola Company Asia Pacific Segment Revenue And Operating Income 2014 to 18. This is part of our Data and Statistics products selection, and you will need a Paid account to download the actual report with accurate data and sources. Downloaded report will contain the editable graph with accurate data, an excel table with the actual data, the exact source of the data and the release date. This slide provides the revenue and operating income of Asia-pacific segment of The Coca Cola Company from 2014 to 2018. Download it immediately and use it for your business.
-
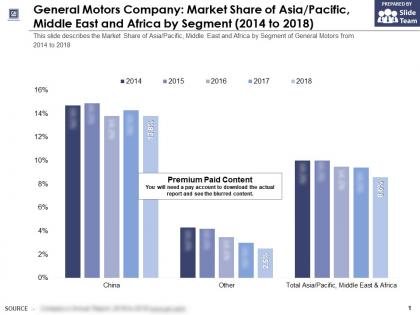 General motors company market share of asia pacific middle east and africa by segment 2014-2018
This is a professionally designed visual chart for General Motors Company Market Share Of Asia Pacific Middle East And Africa By Segment 2014 to 2018. This is part of our Data and Statistics products selection, and you will need a Paid account to download the actual report with accurate data and sources. Downloaded report will contain the editable graph with accurate data, an excel table with the actual data, the exact source of the data and the release date. This slide describes the Market Share of Asia Pacific, Middle East and Africa by Segment of General Motors from 2014 to 2018. Download it immediately and use it for your business.
-
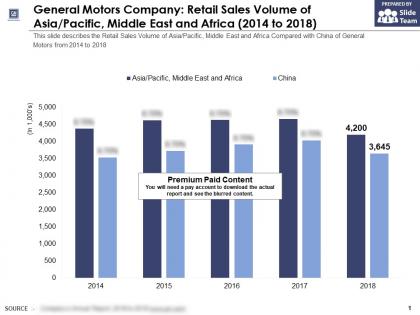 General motors company retail sales volume of asia pacific middle east and africa 2014-2018
This is a professionally designed visual chart for General Motors Company Retail Sales Volume Of Asia Pacific Middle East And Africa 2014 to 2018. This is part of our Data and Statistics products selection, and you will need a Paid account to download the actual report with accurate data and sources. Downloaded report will contain the editable graph with accurate data, an excel table with the actual data, the exact source of the data and the release date. This slide describes the Retail Sales Volume of Asia Pacific, Middle East and Africa Compared with China of General Motors from 2014 to 2018. Download it immediately and use it for your business.
-
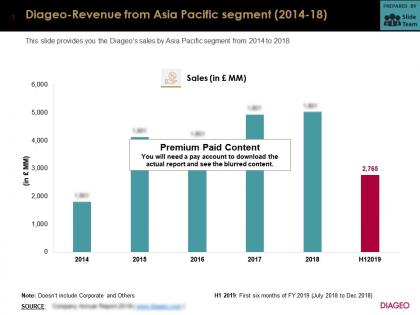 Diageo revenue from asia pacific segment 2014-18
This is a professionally designed visual chart for Diageo Revenue From Asia Pacific Segment 2014 to 18. This is part of our Data and Statistics products selection, and you will need a Paid account to download the actual report with accurate data and sources. Downloaded report will contain the editable graph with accurate data, an excel table with the actual data, the exact source of the data and the release date. This slide provides you the Diageos sales by Asia Pacific segment from 2014 to 2018. Download it immediately and use it for your business.
-
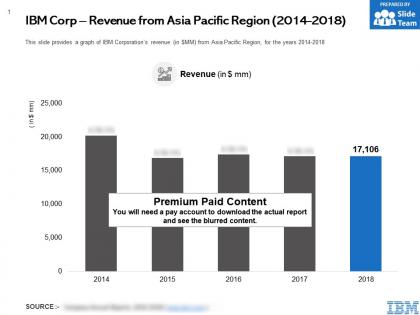 Ibm corp revenue from asia pacific region 2014-2018
This is a professionally designed visual chart for IBM Corp Revenue From Asia Pacific Region 2014 to 2018. This is part of our Data and Statistics products selection, and you will need a Paid account to download the actual report with accurate data and sources. Downloaded report will contain the editable graph with accurate data, an excel table with the actual data, the exact source of the data and the release date. This slide provides a graph of IBM Corporations revenue in JPY MM from Asia Pacific Region for the years 2014 to 2018. Download it immediately and use it for your business.
-
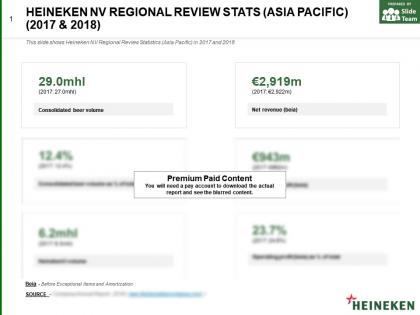 Heineken nv regional review stats asia pacific 2017-2018
The information presented in this slide has been researched by our team of professional business analysts. This is part of our Company Profiles products selection, and you will need a Paid account to download the actual report with accurate data and sources. Downloaded report will be in Powerpoint and will contain the actual editable slides with the actual data and sources for each data. This slide shows Heineken NV Regional Review Statistics Asia Pacific in 2017 to 2018. Download it immediately and use it for your business.


