

Powerpoint Templates for Graph Icon
Save time and engage your audience with our fully editable PowerPoint PPT Templates and Slides.
-

Ai five staged bar graph and icons powerpoint template
Presenting ai five staged bar graph and icons powerpoint template. Five staged bar graph diagram and icons has been used to craft this power point template diagram. This PPT diagram contains the concept of sales result analysis. Use this PPT diagram for business and sales related presentations.
-

Mt four steps lego blocks bar graph with icons powerpoint template slide
Presenting mt four steps lego blocks bar graph with icons powerpoint template slide. Four staged Lego block and bar graph with icons has been used to craft this power point template diagram. This PPT diagram contains the concept of business planning and result analysis. Use this PPT diagram for marketing and business related presentations.
-
Mq four staged lego blocks bar graph with icons powerpoint template slide
Presenting mq four staged lego blocks bar graph with icons powerpoint template slide. Four staged Lego block and bar graph has been used to craft this power point template diagram. This PPT diagram contains the concept of business strategy and result analysis. Use this PPT diagram for marketing and business related presentations.
-
Np three staged lego blocks bar graph with icons powerpoint template slide
Presenting np three staged lego blocks bar graph with icons powerpoint template slide. Three staged Lego block, bar graph with icons has been used to craft this power point template diagram. This PPT diagram contains the concept of business planning and result analysis. Use this PPT diagram for marketing and business related presentations.
-
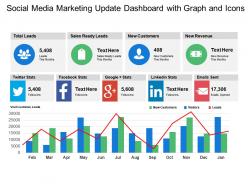
Social media marketing update dashboard with graph and icons
Presenting this set of slides with name - Social Media Marketing Update Dashboard With Graph And Icons. This is a three stage process. The stages in this process are Marketing Update, Marketing Strategy, Marketing Report.
-
Cro graph with icons
Presenting cro graph with icons. This is a cro graph with icons. This is a five stage process. The stages in this process are Cro, conversion rate optimization.
-
Four stages business 3d bar graph with icons and percentage values
Presenting this set of slides with name - Four Stages Business 3d Bar Graph With Icons And Percentage Values. This is a four stage process. The stages in this process are Paint Brush, Art, Coloring.
-
0914 business plan bar graph with icons in ascending order graphic powerpoint template
We are proud to present our 0914 business plan bar graph with icons in ascending order graphic powerpoint template. This image slide displays bar graph with icons. This image slide may be used in your presentations to depict business planning process. Use this innovative image slide in business, marketing and social presentations. You may change color, size and orientation of any icon to your liking. This image slide will enhance the quality of your presentations.
-
Increased price hybrid bowman s strategy clock graph with icons
Presenting this set of slides with name - Increased Price Hybrid Bowman S Strategy Clock Graph With Icons. This is a eight stage process. The stages in this process are Bowman S Strategy Clock, Bowman S Model, Competitive Analysis.
-
Notepad Partnership Introduction Bar Graph Ppt Icons Graphics
All graphics are hundred percent adaptable in the layout slides. Great quality pictures can be used to compliment message. Functions outstandingly in Windows 7, 8, 10, XP, Vista and all PowerPoint form. Altering in presentation slide show ought to be conceivable from wherever by any device. Similarity with Google slides. PPT sensible offers content measurement which can be examined from a division.
-
Financial data growth graph statistics decline graph ppt icons graphics
This PPT slide is a reliable way to present your company's financial matters and its practice related ideas. Engaging figures shown in this template can be resized and their colors can be changed according to your liking. Downloading this slide will give you access to its full version. You can be easily convert it into PDF or JPG formats.
-
Dollar bag target selection growth bar graph ppt icons graphics
We are proud to present our dollar bag target selection growth bar graph ppt icons graphics. This power point icon template diagram has been crafted with graphic of dollar bag and bar graph icons. This PPT diagram contains the concept of target selection and result analysis. Use PPT diagram for business and finance related presentations.
-
Team partnership study bar graph ppt icons graphics
All pictures are hundred percent customizable in the template slides. Great quality pictures can be utilized to compliment message. Functions admirably in Windows 7, 8, 10, XP, Vista and all PowerPoint version. Altering in introduction slide show should be possible from anyplace by any gadget. Similarity with Google slides. PPT realistic offers text dimension which can be perused from a separation.
-
Globe design pie graph with icons flat powerpoint design
Run slides smoothly on all software. Simple transformation to JPG and PDF formats. Compatible with Google slides for easy access. Suitable widescreen viewing without PPT graphics pixilation. Simply insert company logo, name and trademark for personalization. Highly customizable layout including font, text, color and design. High resolution PPT graphics for clarity. Applicable to businesses, startups, strategic organizations, NGO’s, project management.
-
Io six staged bar graph with icons flat powerpoint design
Presenting io six staged bar graph with icons flat powerpoint design. Six staged bar graph diagram and icons has been used to design this PPT diagram. This PPT diagram contains the concept of business result analysis and information representation. Use this PPT diagram for business and marketing related presentations.
-
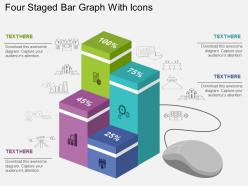
Four staged bar graph with icons flat powerpoint design
We are proud to present our four staged bar graph with icons flat powerpoint design. Four staged bar graph with icons has been used to design this power point template diagram. This PPT diagram contains the concept of result analysis representation. Use this PPT diagram for business and marketing related presentations.
-
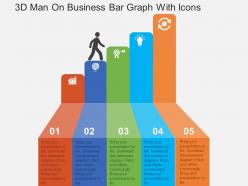
3d man on business bar graph with icons flat powerpoint design
We are proud to present our 3d man on business bar graph with icons flat powerpoint design. This power point template diagram has been crafted with graphic of 3d man and bar graph. This PPT diagram contains the concept of result analysis. Use this PPT diagram for business and marketing related presentations.
-
Pointer sand clock lock bar graph ppt icons graphics
We are proud to present our pointer sand clock lock bar graph ppt icons graphics. Concept of growth analysis been displayed in this PPT icon diagram. This icon template diagram contains the graphic of pointer, bar graph and sand clock icons. Use this icon template for business and marketing related presentations.
-
Four staged vertical bar graph and icons powerpoint slides
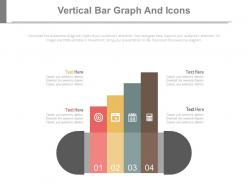
Presenting four staged vertical bar graph and icons powerpoint slides. This Power Point template diagram slide has been crafted with graphic of four staged vertical bar graph and icons diagram. This PPT diagram contains the concept of financial analysis. Use this PPT diagram for business and marketing related presentations.
-
Kb bar graph with icons and success business man flat powerpoint design
Presenting kb bar graph with icons and success business man flat powerpoint design. This Power Point template diagram has been crafted with graphic of bar graph. Business man and icons diagram. This PPT diagram contains the concept of success and result analysis .Use this PPT diagram for business and finance related presentations.
-
Awards folder delivery time graph ppt icons graphics
Presenting awards folder delivery time graph ppt icons graphics. This Power Point icon template diagram has been crafted with graphic of awards, folder and time graph icons. This icon template contains the concept of success and on time shipping .Use this icon template for business and marketing related presentations.
-
Data record human brain gear bar graph ppt icons graphics
We are proud to present our data record human brain gear bar graph ppt icons graphics. This power point icon template diagram has been crafted with graphic of data ,human brain and gear with bar graph icons. This PPT diagram contains the concept of financial analysis and income tax growth. Use PPT diagram can be used for business and finance related presentations.
-
Si four staged linear bar graph with icons flat powerpoint design
Presenting si four staged linear bar graph with icons flat powerpoint design. Four staged linear bar graph and icons has been used to craft this power point template diagram. This PPT diagram contains the concept of business result analysis representation. Use this PPT diagram for business and marketing related presentations.
-
Three steps team financial analysis bar graph ppt icons graphics
Presenting three steps team financial analysis bar graph ppt icons graphics. This Power Point template icons slide has been crafted with graphic of three steps, bar graph and team icons. This icon PPT contains the concept of financial analysis and team management. Use this icon PPT for business and finance related presentations.
-
Filter Icon Funnel Graph Arrow Dollar Investment Gears Process
This complete presentation has PPT slides on wide range of topics highlighting the core areas of your business needs. It has professionally designed templates with relevant visuals and subject driven content. This presentation deck has total of ten slides. Get access to the customizable templates. Our designers have created editable templates for your convenience. You can edit the colour, text and font size as per your need. You can add or delete the content if required. You are just a click to away to have this ready-made presentation. Click the download button now.
-
Network Diagrams Graph Chart Monotone Icon In Powerpoint Pptx Png And Editable Eps Format
This Monotone powerpoint icon on Graph Chart is an ideal choice for presentations, reports, and other documents. It is a simple and effective way to visualize data and make it easier to understand. It is a great tool for data analysis and can be used to compare trends, illustrate relationships, and more.
-
Data Handling Graph Technology Monotone Icon In Powerpoint Pptx Png And Editable Eps Format
This monotone PowerPoint icon is perfect for representing data handling topics. It features a graph and a magnifying glass, perfect for illustrating data analysis and research. Its a great choice for presentations on data handling, analytics, and research.
-
Data Virtualisation Graph Database Colored Icon In Powerpoint Pptx Png And Editable Eps Format
Enhance your presentations with this eye-catching PowerPoint icon featuring a colourful graph line symbolizing the power of data virtualisation. Perfect for showcasing the benefits and capabilities of this innovative technology in a visually appealing way. Grab your audiences attention and elevate your slides with this vibrant icon.
-
Bar Graph Data Monotone Icon In Powerpoint Pptx Png And Editable Eps Format
Make your presentation profoundly eye-catching leveraging our easily customizable Bar graph data monotone icon in powerpoint pptx png and editable eps format. It is designed to draw the attention of your audience. Available in all editable formats, including PPTx, png, and eps, you can tweak it to deliver your message with ease.
-
Plan Sprint Review Icon With Graph
Presenting our well-structured Plan Sprint Review Icon With Graph. The topics discussed in this slide are Plan Sprint Review, Icon, Graph. This is an instantly available PowerPoint presentation that can be edited conveniently. Download it right away and captivate your audience.
-
Transportation Metrics Graph Chart Monotone Icon In Powerpoint Pptx Png And Editable Eps Format
Make your presentation profoundly eye-catching leveraging our easily customizable Transportation metrics graph chart monotone icon in powerpoint pptx png and editable eps format. It is designed to draw the attention of your audience. Available in all editable formats, including PPTx, png, and eps, you can tweak it to deliver your message with ease.
-
Managers Personal Development Plan Icon With Graph
Introducing our Managers Personal Development Plan Icon With Graph set of slides. The topics discussed in these slides are Managers Personal, Development Plan, Icon Graph. This is an immediately available PowerPoint presentation that can be conveniently customized. Download it and convince your audience.
-
Bar Graph Data Colored Icon In Powerpoint Pptx Png And Editable Eps Format
Give your next presentation a sophisticated, yet modern look with this 100 percent editable Bar graph data colored icon in powerpoint pptx png and editable eps format. Choose from a variety of customizable formats such as PPTx, png, eps. You can use these icons for your presentations, banners, templates, One-pagers that suit your business needs.
-
Sequential timeline with gear bar graph and social icon flat powerpoint design
Slide runs easily on all software. Download slides in matter of moments. Insert company logo, name or trademark with no trouble. No pixilation when slide is projected on widescreen. Quite compatible with google slides. Display titles and subtitles with zero space constraints. High resolution PPT slides. Convert to JPG and PDF formats effortlessly. Useful for businesses, project management and startups.
-
Sales growth icon bar graph with upward moving arrow
Presenting this set of slides with name - sales growth icon bar graph with upward moving arrow. This is a one stage process. The stages in this process are Sales Growth Icon, Sales Improvement Icon, Lead Growth Icon.
-
Sales growth icon bar graph and upward arrow
Presenting this set of slides with name - sales growth icon bar graph and upward arrow. This is a one stage process. The stages in this process are Sales Growth Icon, Sales Improvement Icon, Lead Growth Icon.
-
0115 human icon bar graph for business powerpoint template
High resolution PPT slides catering to all the needs related to achieving smart goals. We have prepared PowerPoint info graphics of smart goals that is objective should be specific, measurable, authentic, and reasonable and time bound. Relevant content with flexible data. Can be easily converted to PDF and JPF format. Beneficial for students, researchers, business professional and corporative people.
-
Performance summary bar graph line ppt icon
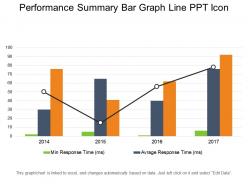
Presenting the slide named Performance Summary Bar Graph Line PPT Icon. Customize this easy to use template with font colour, font size and font style of your choice. You can easily arrange the bar categories sequentially for best readability. The text in the template can be rewritten. The colour of the background and bar graph can be changed. You can choose from a wide variety of icons that we offer and can replace them in accordance with your purpose. This template is compatible with Google Slides. You can save this slide in both PDF and JPG formats.
-
Demand forecast graph template ppt icon
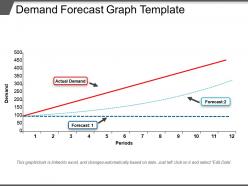
Presenting Demand Forecast Graph Template PPT Icon which is designed by our professionals for your convenience. Open and save your presentation into formats like PDF, PNG, and JPG. The slide is available in both 4:3 and 16:9 aspect ratio. The template is adaptable with Google Slides, which makes it easily accessible. You can also change the color, fonts, font size, and font types of the template as per the requirement.
-
Marketing objective icon with graph and target
Presenting this set of slides with name Marketing Objective Icon With Graph And Target. This is a three stage process. The stages in this process are Marketing Objective, Target, Brand Management. This is a completely editable PowerPoint presentation and is available for immediate download. Download now and impress your audience.
-
Project outcome icon with graph and target icon
Presenting this set of slides with name Project Outcome Icon With Graph And Target Icon. This is a three stage process. The stages in this process are Project Outcome, Target, Goal. This is a completely editable PowerPoint presentation and is available for immediate download. Download now and impress your audience.
-
Situation analysis icon with graph and plus minus signs
Presenting this set of slides with name - Situation Analysis Icon With Graph And Plus Minus Signs. This is a four stage process. The stages in this process are Situation Analysis Icon, Strategic Management Icon, Marketing Plan Icon.
-
Sales man silhouette icon with graph ppt diagrams
Presenting Sales Man Silhouette Icon With graph PPT Diagrams. This slide is professionally designed and 100% editable. You can alter the color, font, font size and font types of the slides as per your requirement. It is available in both standard and widescreen. This template is adaptable with Google Slides which makes it easily accessible at once. Can be converted into formats like PDF, JPG and PNG.
-
Loss icon with graph and cross
Presenting this set of slides with name Loss Icon With Graph And Cross. This is a four stage process. The stages in this process are Graph, Decline, Arrow. This is a completely editable PowerPoint presentation and is available for immediate download. Download now and impress your audience.
-
Situation analysis icon with graph
Presenting this set of slides with name Situation Analysis Icon With Graph. This is a four stage process. The stages in this process are Situation Analysis Icon With Graph. This is a completely editable PowerPoint presentation and is available for immediate download. Download now and impress your audience.
-
Project plan icon with graph and gear
Presenting our set of slides with name Project Plan Icon With Graph And Gear. This exhibits information on three stages of the process. This is an easy-to-edit and innovatively designed PowerPoint template. So download immediately and highlight information on Project Plan Icon With Graph And Gear.
-
Earned value management icon with graph and currency symbol
Presenting our set of slides with name Earned Value Management Icon With Graph And Currency Symbol. This exhibits information on four stages of the process. This is an easy-to-edit and innovatively designed PowerPoint template. So download immediately and highlight information on Earned Value Management Icon With Graph And Currency Symbol
-
Abc analysis icon with graph
Presenting this set of slides with name ABC Analysis Icon With Graph. This is a four stage process. The stages in this process are ABC, Analysis Icon, Graph. This is a completely editable PowerPoint presentation and is available for immediate download. Download now and impress your audience.
-
Twelve staged lego blocks bar graph and business icons powerpoint template slide
We are proud to present our twelve staged lego blocks bar graph and business icons powerpoint template slide. Twelve staged Lego blocks bar graph and business icons has been used to craft this power point template diagram. This PPT diagram contains the concept of business result analysis techniques .Use this PPT diagram for business and marketing related presentations.
-
0914 business plan bar graph cube bars icons image slide powerpoint presentation template
We are proud to present our 0914 business plan bar graph cube bars icons image slide powerpoint presentation template. This image slide displays abstract 3d four options cube bars. Use this image slide, in your presentations to express views on progress, growth and steps. It may also be used for analyzing market research. This image slide will enhance the quality of your presentations.
-
Ten staged business icons pie graph powerpoint template
They provide the convenience to manually organize the icons and edit the information. Merging this PPT design with the presentation is effortless and does not require much time. It has a hassle free downloading. Enhance the impact of your presentation. Runs effortlessly with all software’s. Can be presented on both standard and widescreen formats.
-
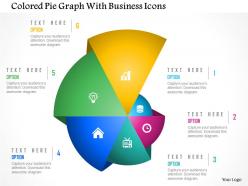
Colored pie graph with business icons powerpoint template
We are proud to present our colored pie graph with business icons powerpoint template. Graphic of colored pie graph and icons has been used to craft this PPT diagram. This PPT diagram contains the concept of business informationand result analysis . Use this PPT diagram for business and marketing presentations.
-
Eight staged pie graph for business icons flat powerpoint design
Healthy provision for adding necessary details pertaining to a particular system or process. Compatibility with other softwares is seamless. Presentation uses high definition graphic templates which implies crystal clear image quality on bigger or wider screens. Saves a lot of space as it can be converted into a JPG or PDF file. Bars signifying eight stages are customisable when it comes to color and size.
-
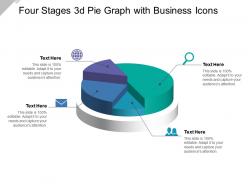
Four stages 3d pie graph with business icons
Presenting this set of slides with name - Four Stages 3d Pie Graph With Business Icons. This is a four stage process. The stages in this process are Paint Brush, Art, Coloring.
-
Four staged pie graph for business icons flat powerpoint design
We are proud to present our four staged pie graph for business icons flat powerpoint design. Four staged pie graph has been used to craft this power point template. This diagram template contains the concept of business and result analysis. Use this PPT diagram for business and marketing related presentations.
-
Five steps sales process bar graph arrow with icons
Presenting this set of slides with name - Five Steps Sales Process Bar Graph Arrow With Icons. This is a five stage process. The stages in this process are Sales Process, Sales Procedure, Sales Management.
-
Business idea generation mobile growth bar graph devices ppt icons graphics
High resolution PPT example for Technology Vision. Wide screen projection does not affect the output adversely. Easy to edit and customize colorful PPT graphics. Precise and easy to comprehend information on PPT sample. Increase the level of personalization with your company logo and name. Compatible with all software and can be saved in any format. Useful for business analysts, research and development team etc.
-
Globe with bar graph and business icons flat powerpoint design
We are proud to present our globe with bar graph and business icons flat powerpoint design. Graphic of globe and bar graph with business icons has been used to craft this power point template diagram. This PPT diagram contains the concept of result analysis. Use this PPT diagram for business and marketing related presentations.
-
Lj laptop with bar graph and multiple icons flat powerpoint design
Presenting lj laptop with bar graph and multiple icons flat powerpoint design. This Power Point template diagram has been crafted with graphic of laptop and bar graph diagram. This PPT diagram contains the concept of technology application for growth study and analysis. Use this PPT diagram for business and marketing related presentations.
-
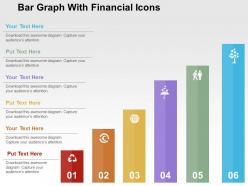
Bar graph with financial icons flat powerpoint design
Impressive use of colors and design. Eye catchy visuals. Images are of high resolution. No fear of pixilation when projected on wide screen. Compatible with large number of online and offline software options. Harmonious with numerous format options. Thoroughly editable slide. Include or exclude the content at ease. Personalize the presentation with company name and logo of yours.
















 Back
