Powerpoint Templates for Statistics Slide
Save time and engage your audience with our fully editable PowerPoint PPT Templates and Slides.
-

Four steps arrow process of meeting productivity statistics slide infographic template
This is a single slide titled Four Steps Arrow Process Of Meeting Productivity Statistics Slide Infographic Template. It is crafted using high quality vector based visuals that are 100 percent editable and available for immediate download in standard and widescreen aspect ratios.
-

Author Collaboration Networks Publication Statistics PPT Slide ST AI SS
Increase audience engagement and knowledge by dispensing information using Author Collaboration Networks Publication Statistics PPT Slide ST AI SS This template helps you present information on eight stages. You can also present information on Co authorship Analysis,Publication Metrics,Research Network Visualization,Scholarly Impact Assessment using this PPT design. This layout is completely editable so personalize it now to meet your audiences expectations.
-
Attribution based on data and statistics ppt slide templates
Presenting attribution based on data and statistics ppt slide templates. This is a attribution based on data and statistics ppt slide templates. This is a five stage process. The stages in this process are display, seo, direct, social, natural search.
-
Business development statistics results slide powerpoint templates
Presenting business development statistics results slide powerpoint templates. This is a business development statistics results slide powerpoint templates. This is a five stage process. The stages in this process are results, output, deliverables, goals.
-
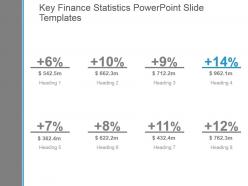
Key finance statistics powerpoint slide templates
Presenting key finance statistics powerpoint slide templates. This is a key finance statistics powerpoint slide templates. This is a eight stage process. The stages in this process are business, success, strategy, management, marketing, process.
-
Key statistics powerpoint slide templates
Presenting this set of slides with name - Key Statistics Powerpoint Slide Templates. This is a four stage process. The stages in this process are Pie Chart, Marketing, Analysis, Strategy, Business.
-
Events Audit Dashboard With Various Statistics PPT Slides AT
Ditch the Dull templates and opt for our engaging Events Audit Dashboard With Various Statistics PPT Slides AT deck to attract your audience. Our visually striking design effortlessly combines creativity with functionality, ensuring your content shines through. Compatible with Microsoft versions and Google Slides, it offers seamless integration of presentation. Save time and effort with our pre designed PPT layout, while still having the freedom to customize fonts, colors, and everything you ask for. With the ability to download in various formats like JPG, JPEG, and PNG, sharing your slides has never been easier. From boardroom meetings to client pitches, this deck can be the secret weapon to leaving a lasting impression.
-
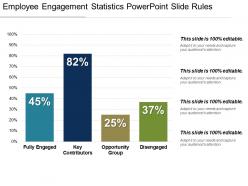
Employee engagement statistics powerpoint slide rules
Presenting our employee engagement statistics PowerPoint slide rules. This PPT slide offers you plenty of space to put in titles and subtitles. High resolution based presentation layout, does not change the image even after resizing. This presentation icon is data driven and template can be downloaded via excel file to incorporate data. Quick downloading speed and simple editing options in color text and fonts.PPT icons can easily be changed into JPEG and PDF applications.
-
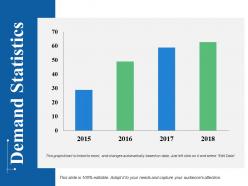
Demand statistics powerpoint slide themes
Presenting this set of slides with name - Demand Statistics Powerpoint Slide Themes. This is a four stage process. The stages in this process are Business, Marketing, Finance, Planning, Analysis.
-
Introduce New Product Market Statistics PPT Slides AT
Step up your game with our enchanting Introduce New Product Market Statistics PPT Slides AT deck, guaranteed to leave a lasting impression on your audience. Crafted with a perfect balance of simplicity, and innovation, our deck empowers you to alter it to your specific needs. You can also change the color theme of the slide to mold it to your companys specific needs. Save time with our ready made design, compatible with Microsoft versions and Google Slides. Additionally, its available for download in various formats including JPG, JPEG, and PNG. Outshine your competitors with our fully editable and customized deck.
-
Global HIV Epidemiology Trends And Statistics PPT Slides AT
Step up your game with our enchanting Global HIV Epidemiology Trends And Statistics PPT Slides AT deck, guaranteed to leave a lasting impression on your audience. Crafted with a perfect balance of simplicity, and innovation, our deck empowers you to alter it to your specific needs. You can also change the color theme of the slide to mold it to your companys specific needs. Save time with our ready-made design, compatible with Microsoft versions and Google Slides. Additionally, its available for download in various formats including JPG, JPEG, and PNG. Outshine your competitors with our fully editable and customized deck.
-
Measuring Gender Inequality Through Demographic Statistics PPT Slides AT
While your presentation may contain top-notch content, if it lacks visual appeal, you are not fully engaging your audience. Introducing our Measuring Gender Inequality Through Demographic Statistics PPT Slides AT deck, designed to engage your audience. Our complete deck boasts a seamless blend of Creativity and versatility. You can effortlessly customize elements and color schemes to align with your brand identity. Save precious time with our pre-designed template, compatible with Microsoft versions and Google Slides. Plus, its downloadable in multiple formats like JPG, JPEG, and PNG. Elevate your presentations and outshine your competitors effortlessly with our visually stunning 100 percent editable deck.
-
Management departments statistics chart ppt slide show
Presenting management departments statistics chart ppt slide show. This is a management departments statistics chart ppt slide show. This is a stage process. The stages in this process are budgeting, production, assets, project management, payroll, sales.
-
Biotechnology Statistics PPT Slides VA
Beneath the surface of data lies the exciting realm of biotechnology and our meticulously crafted biotechnology statistics PPT slides are your gateway to powerful visual storytelling. Engage your audience with dynamic presentation graphics that highlight pivotal data points and trends in the biotech landscape. This presentation deck is rich with editable slides ensuring your concepts are communicated clearly while maintaining an aesthetically pleasing modern slide design. Whether youre delivering a corporate presentation or a strategy deck for investors these templates provide the flexibility to adapt your narrative. Dive into the world of innovation and make your statistics shine with impactful datadriven insights.
-
Acid Rain Global Trends And Statistics PPT Slides AT
Ditch the Dull templates and opt for our engaging Acid Rain Global Trends And Statistics PPT Slides AT deck to attract your audience. Our visually striking design effortlessly combines creativity with functionality, ensuring your content shines through. Compatible with Microsoft versions and Google Slides, it offers seamless integration of presentation. Save time and effort with our pre-designed PPT layout, while still having the freedom to customize fonts, colors, and everything you ask for. With the ability to download in various formats like JPG, JPEG, and PNG, sharing your slides has never been easier. From boardroom meetings to client pitches, this deck can be the secret weapon to leaving a lasting impression.
-
Application Of Business Statistics PPT Slides VA
Unlock the potential of your data with our application of business statistics PPT slides. This presentation deck fuses elegant modern slide design with impactful visuals that breathe life into your analysis. Prepare to captivate your audience as you weave in compelling storytelling and insightful data visualization that reveals trends and patterns. Perfect for corporate presentations or consulting discussions these editable slides allow for seamless customization making your insights even more relatable. With a variety of infographic templates at your disposal convey complex statistical concepts with clarity and creativity. Elevate your narrative and demonstrate the value of datadriven decisions today.
-
Critical US Banking Profitability Statistics PPT Slides AT
Do not compromise on a template that erodes your messages impact. Introducing our engaging Critical US Banking Profitability Statistics PPT Slides AT complete deck, thoughtfully crafted to grab your audiences attention instantly. With this deck, effortlessly download and adjust elements, streamlining the customization process. Whether you are using Microsoft versions or Google Slides, it fits seamlessly into your workflow. Furthermore, it is accessible in JPG, JPEG, PNG, and PDF formats, facilitating easy sharing and editing. Not only that you also play with the color theme of your slides making it suitable as per your audiences preference.
-
Safety Strategy Slide
Presenting our set of slides with name Safety Strategy Slide. This exhibits information on two stages of the process. This is an easy to edit and innovatively designed PowerPoint template. So download immediately and highlight information on Safety Strategy.
-
Hepatitis A Global Impact And Statistics PPT Slides AT
While your presentation may contain top-notch content, if it lacks visual appeal, you are not fully engaging your audience. Introducing our Hepatitis A Global Impact And Statistics PPT Slides AT deck, designed to engage your audience. Our complete deck boasts a seamless blend of Creativity and versatility. You can effortlessly customize elements and color schemes to align with your brand identity. Save precious time with our pre-designed template, compatible with Microsoft versions and Google Slides. Plus, its downloadable in multiple formats like JPG, JPEG, and PNG. Elevate your presentations and outshine your competitors effortlessly with our visually stunning 100 percent editable deck.
-
Icons Slide For Statistical Analysis For Data Driven Decision Making
Introducing our well researched set of slides titled Icons Slide For Statistical Analysis For Data Driven Decision Making. It displays a hundred percent editable icons. You can use these icons in your presentation to captivate your audiences attention. Download now and use it multiple times.
-
Four Steps Arrow Process Meeting Productivity Statistics PPT Slides AT
Do not compromise on a template that erodes your messages impact. Introducing our engaging Four Steps Arrow Process Meeting Productivity Statistics PPT Slides AT complete deck, thoughtfully crafted to grab your audiences attention instantly. With this deck, effortlessly download and adjust elements, streamlining the customization process. Whether you are using Microsoft versions or Google Slides, it fits seamlessly into your workflow. Furthermore, it is accessible in JPG, JPEG, PNG, and PDF formats, facilitating easy sharing and editing. Not only that you also play with the color theme of your slides making it suitable as per your audiences preference.
-
Fitness industry statistics powerpoint presentation slides
This complete deck can be used to present to your team. It has PPT slides on various topics highlighting all the core areas of your business needs. This complete deck focuses on Fitness Industry Statistics Powerpoint Presentation Slides and has professionally designed templates with suitable visuals and appropriate content. This deck consists of total of eighty two slides. All the slides are completely customizable for your convenience. You can change the colour, text and font size of these templates. You can add or delete the content if needed. Get access to this professionally designed complete presentation by clicking the download button below.
-
Business Entity Mind Map Statistics PPT Slides AT
While your presentation may contain top-notch content, if it lacks visual appeal, you are not fully engaging your audience. Introducing our Business Entity Mind Map Statistics PPT Slides AT deck, designed to engage your audience. Our complete deck boasts a seamless blend of Creativity and versatility. You can effortlessly customize elements and color schemes to align with your brand identity. Save precious time with our pre-designed template, compatible with Microsoft versions and Google Slides. Plus, its downloadable in multiple formats like JPG, JPEG, and PNG. Elevate your presentations and outshine your competitors effortlessly with our visually stunning 100 percent editable deck.
-
Tuberculosis Global Impact And Statistics PPT Slides AT
Step up your game with our enchanting Tuberculosis Global Impact And Statistics PPT Slides AT deck, guaranteed to leave a lasting impression on your audience. Crafted with a perfect balance of simplicity, and innovation, our deck empowers you to alter it to your specific needs. You can also change the color theme of the slide to mold it to your companys specific needs. Save time with our ready-made design, compatible with Microsoft versions and Google Slides. Additionally, its available for download in various formats including JPG, JPEG, and PNG. Outshine your competitors with our fully editable and customized deck.
-
Social Media Content Tracking Sheet With Statistics PPT Slides AT
Do not compromise on a template that erodes your messages impact. Introducing our engaging Social Media Content Tracking Sheet With Statistics PPT Slides AT complete deck, thoughtfully crafted to grab your audiences attention instantly. With this deck, effortlessly download and adjust elements, streamlining the customization process. Whether you are using Microsoft versions or Google Slides, it fits seamlessly into your workflow. Furthermore, it is accessible in JPG, JPEG, PNG, and PDF formats, facilitating easy sharing and editing. Not only that you also play with the color theme of your slides making it suitable as per your audiences preference.
-
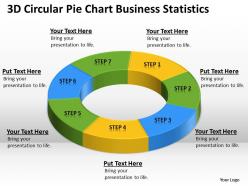
Business workflow diagram 3d circular pie chart statistics powerpoint slides
We are proud to present our business workflow diagram 3d circular pie chart statistics powerpoint slides. The above PowerPoint diagram contains an image of 3d pie chart also known as donut diagram. This diagram is a graphical representation of a business process flow, consisting of activities and the connections between these activities.
-
Drop Servicing Business Model Statistics Ppt Slides
This slide represents the key statistics related to drop servicing business model. Various stats included are percentage increase in profit margins, percentage of successful businesses using white labelling and service arbitrage, etc. Introducing our Drop Servicing Business Model Statistics Ppt Slides set of slides. The topics discussed in these slides are Service Arbitrage Business Models, Drop Servicing Business, Digital Marketing Niche. This is an immediately available PowerPoint presentation that can be conveniently customized. Download it and convince your audience.
-
Global Design And Architecture Firm Business Statistics Ppt Slides Templates
This slide highlights the architecture company statistics which include public and private clients, total projects finalized, free cash flow, client satisfaction and sustainable contribution. Deliver an outstanding presentation on the topic using this Global Design And Architecture Firm Business Statistics Ppt Slides Templates. Dispense information and present a thorough explanation of Business Statistics, Revenue, Contribution using the slides given. This template can be altered and personalized to fit your needs. It is also available for immediate download. So grab it now.
-
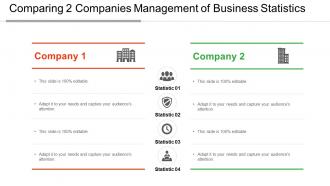
Comparing 2 companies management of business statistics ppt slides
Presenting Comparing 2 Companies Management Of Business Statistics PPT Slides. Get this completely customizable template and make changes in this according to your needs. Change the colors of this template and adjust the font type and font size as per the requirement. You can also add a suitable icon in this template. This is completely compatible with the Google Slides and you can convert this in various formats including JPG and PDF formats. This template can be downloaded and viewed on standard screen and widescreen.
-
Social media key statistics icons slides growth dollar ppt powerpoint presentation show maker
Presenting this set of slides with name Social Media Key Statistics Icons Slides Growth Dollar Ppt Powerpoint Presentation Show Maker. The topics discussed in these slides are Growth, Finance, Dollar, Our Goal, Threat. This is a completely editable PowerPoint presentation and is available for immediate download. Download now and impress your audience.
-
Social Worker Work Statistics Overview PPT Slides AT
Step up your game with our enchanting Social Worker Work Statistics Overview PPT Slides AT deck, guaranteed to leave a lasting impression on your audience. Crafted with a perfect balance of simplicity, and innovation, our deck empowers you to alter it to your specific needs. You can also change the color theme of the slide to mold it to your companys specific needs. Save time with our ready-made design, compatible with Microsoft versions and Google Slides. Additionally, its available for download in various formats including JPG, JPEG, and PNG. Outshine your competitors with our fully editable and customized deck.
-
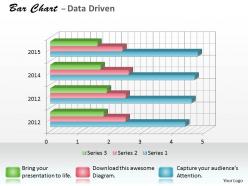
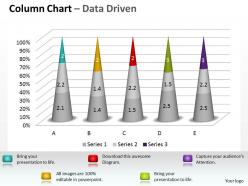
Data driven 3d bar chart for research in statistics powerpoint slides
Presenting data driven 3d bar chart for research in statistics presentation slides. Effortlessly alterable template slide as stats in excel sheet styles are customizable. This presentation slide is entirely flexible with Google Slides. Easy to download this template and save into JPEG and PDF format. Application of the best graphics, color, and icons. Quick to insert organization image, name, signature, copyright and picture for personalization of slide. Graphics quality does not get harm when displayed on widescreen. Instructional slides are available for guidance.
-
Global Industry Statistics Related Implementing Agile Methodology Ppt Slide
The purpose of this slide is to represent industry statistics to provide insights about agile marketing methodology. It includes various elements such as time to market, switching gears, task prioritization, customer needs, etc.Increase audience engagement and knowledge by dispensing information using Global Industry Statistics Related Implementing Agile Methodology Ppt Slide. This template helps you present information on six stages. You can also present information on Global Industry Statistics, Marketing Personnel, Marketers Believe Agile using this PPT design. This layout is completely editable so personaize it now to meet your audiences expectations.
-
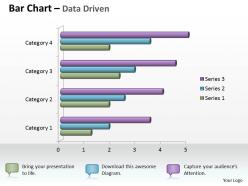
Data driven 3d bar chart for business statistics powerpoint slides
We are proud to present our data driven 3d bar chart for business statistics powerpoint slides. This Professionally designed PowerPoint template shows bar chart for business statistics. Using visual representations to present data and evaluation of activities makes audience easier to understand.
-
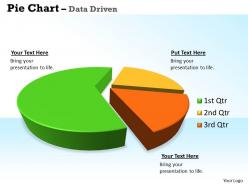
Data driven 3d pie chart for business statistics powerpoint slides
We are proud to present our data driven 3d pie chart for business statistics powerpoint slides. Put The Wind In Your Sails With Our Data Driven 3D Pie Chart For Business Statistics Powerpoint Slides Power Point Templates. Skim Smoothly Over The Choppy Waters Of The Market. Let Our Data Driven 3D Pie Chart For Business Statistics Powerpoint Slides Power Point Templates Give The Updraft To Your Ideas. See Them Soar To Great Heights With Ease.
-
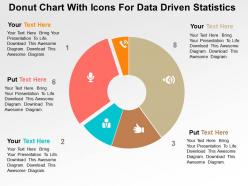
Donut chart with icons for data driven statistics powerpoint slides
Businessmen, micro, small and medium enterprises can use the PPT visual as a master slide. PowerPoint presentation supports filling background in a different color from the text. All images are 100% editable in the presentation slide. Text can be differentiated form the background by the handy features provided by PPT layout. There is no space constrain in the PowerPoint design, thus enabling easy addition or edition of data.
-
Key Statistics For Business Success PPT Slides AT
Step up your game with our enchanting Key Statistics For Business Success PPT Slides AT deck, guaranteed to leave a lasting impression on your audience. Crafted with a perfect balance of simplicity, and innovation, our deck empowers you to alter it to your specific needs. You can also change the color theme of the slide to mold it to your companys specific needs. Save time with our ready made design, compatible with Microsoft versions and Google Slides. Additionally, its available for download in various formats including JPG, JPEG, and PNG. Outshine your competitors with our fully editable and customized deck.
-
Data driven 3d chart for interpretation of statistics powerpoint slides
We are proud to present our data driven 3d chart for interpretation of statistics powerpoint slides. A bar graph is composed of discrete bars that represent different categories of data. The length or height of the bar is equal to the quantity within that category of data. Bar graphs are best used to compare values across categories.
-
Covid 19 impact on aviation tourism trade and global economy statistics ppt slides
Following slide displays coronavirus impact on airline passenger traffic, tourism sector, merchandise trade volume, RPKs and world GDP. Presenting this set of slides with name COVID 19 Impact On Aviation Tourism Trade And Global Economy Statistics Ppt Slides. This is a five stage process. The stages in this process are Airline Passenger Traffic, Airlines, Trade, Global, Economy, Tourism. This is a completely editable PowerPoint presentation and is available for immediate download. Download now and impress your audience.
-
Media advertising statistics template powerpoint slide influencers
Presenting media advertising statistics template powerpoint slide influencers. This is a media advertising statistics template powerpoint slide influencers. This is a five stage process. The stages in this process are google, linkedin, twitter, youtube, facebook.
-
World Map Statistics Powerpoint Template Bundles Ppt Slide
If you require a professional template with great design, then this World Map Statistics Powerpoint Template Bundles Ppt Slide is an ideal fit for you. Deploy it to enthrall your audience and increase your presentation threshold with the right graphics, images, and structure. Portray your ideas and vision using seven slides included in this complete deck. This template is suitable for expert discussion meetings presenting your views on the topic. With a variety of slides having the same thematic representation, this template can be regarded as a complete package. It employs some of the best design practices, so everything is well-structured. Not only this, it responds to all your needs and requirements by quickly adapting itself to the changes you make. This PPT slideshow is available for immediate download in PNG, JPG, and PDF formats, further enhancing its usability. Grab it by clicking the download button.
-
Email advertising statistics diagram ppt slide examples
Presenting email advertising statistics diagram ppt slide examples. This is a email advertising statistics diagram ppt slide examples. This is a four stage process. The stages in this process are email, internet display, catalogs, keyword ads.
-
Cultural diversity workplace statistics ppt powerpoint slide download cpb
Presenting our Cultural Diversity Workplace Statistics Ppt Powerpoint Slide Download Cpb PowerPoint template design. This PowerPoint slide showcases six stages. It is useful to share insightful information on Cultural Diversity Workplace Statistics This PPT slide can be easily accessed in standard screen 4.3 and widescreen 16.9 aspect ratios. It is also available in various formats like PDF, PNG, and JPG. Not only this, the PowerPoint slideshow is completely editable and you can effortlessly modify the font size, font type, and shapes according to your wish. Our PPT layout is compatible with Google Slides as well, so download and edit it as per your knowledge.
-
Correlation Statistics In Powerpoint And Google Slides Cpb
Presenting our Correlation Statistics In Powerpoint And Google Slides Cpb PowerPoint template design. This PowerPoint slide showcases Three stages. It is useful to share insightful information on Correlation Statistics This PPT slide can be easily accessed in standard screen and widescreen aspect ratios. It is also available in various formats like PDF, PNG, and JPG. Not only this, the PowerPoint slideshow is completely editable and you can effortlessly modify the font size, font type, and shapes according to your wish. Our PPT layout is compatible with Google Slides as well, so download and edit it as per your knowledge.
-
Key Demographic Statistics Visualized PPT Slides AT
Do not compromise on a template that erodes your messages impact. Introducing our engaging Key Demographic Statistics Visualized PPT Slides AT complete deck, thoughtfully crafted to grab your audiences attention instantly. With this deck, effortlessly download and adjust elements, streamlining the customization process. Whether you are using Microsoft versions or Google Slides, it fits seamlessly into your workflow. Furthermore, it is accessible in JPG, JPEG, PNG, and PDF formats, facilitating easy sharing and editing. Not only that you also play with the color theme of your slides making it suitable as per your audiences preference.
-
Bar Graph Statistics Research PPT Slides VA
Visual storytelling comes alive with our exceptional bar graph statistics research PPT slides. Perfect for datadriven presentations these vibrant and editable slides are tailored to effectively communicate your findings and insights. Each visual element is crafted to enhance clarity and engagement making your corporate presentation or consulting pitch both impactful and memorable. With modern slide designs at your fingertips you can emphasize key trends and statistics through dynamic layouts that nurture understanding and retention. Unlock the potential of your research with this versatile presentation bundle designed to captivate and inform your audience while ensuring your message resonates clearly.
-
Social Media Key Statistics Powerpoint Presentation Slides
Download our professional PPT comprising extensively researched content and professional design layouts. Don't waste hours fiddling with PowerPoint toolbars and finding professional PowerPoint templates. This complete Social Media Key Statistics Powerpoint Presentation Slides saves hours of your time. Comprising a total of thirty-five slides, the PowerPoint presentation is a visual masterpiece with professional PPT templates, data-driven graphs, charts and tables, a beautiful theme, impressive slide designs, icons, imagery and more. It is fully editable so that you can make changes to colors, data and fonts if you need to. The slide deck is available at 4:3 and 16:9 design sizes.
-
Saas Customer Dashboard Slide For Calculate Statistical Power Infographic Template
This is our Saas Customer Dashboard Slide For Calculate Statistical Power Infographic Template designed in PowerPoint, however, you can also access it in Google Slides. It comes in two aspect ratios standard and widescreen, with fully-editable visual content.
-
Mastering Primary Data Statistics Essentials PPT Slides AT
Do not compromise on a template that erodes your messages impact. Introducing our engaging Mastering Primary Data Statistics Essentials PPT Slides AT complete deck, thoughtfully crafted to grab your audiences attention instantly. With this deck, effortlessly download and adjust elements, streamlining the customization process. Whether you are using Microsoft versions or Google Slides, it fits seamlessly into your workflow. Furthermore, it is accessible in JPG, JPEG, PNG, and PDF formats, facilitating easy sharing and editing. Not only that you also play with the color theme of your slides making it suitable as per your audiences preference.
-
Fine Dine Startup Business Plan Global Food Industry Statistics Highlights Ppt Slides
The following slide outlines various statistics showing market trends, opportunities and growth drivers of global food industry. It showcases information such as annual revenue, daily calorie intake, foods from various countries and cultures, etc. Present the topic in a bit more detail with this Fine Dine Startup Business Plan Global Food Industry Statistics Highlights Ppt Slides. Use it as a tool for discussion and navigation on Global Food Industry, Statistics Highlights, Quick Service Restaurants. This template is free to edit as deemed fit for your organization. Therefore download it now.
-
Ethical awareness key statistics geographical ppt slides
Presenting this set of slides with name Ethical Awareness Key Statistics Geographical Ppt Slides. This is a three stage process. The stages in this process are Timeline, Process, Management, Planning, Business. This is a completely editable PowerPoint presentation and is available for immediate download. Download now and impress your audience.
-
Homeschool Social Skills Statistics In Ppt Powerpoint Presentation Slide Templates Cpp
Presenting our Homeschool Social Skills Statistics In Ppt Powerpoint Presentation Slide Templates Cpp PowerPoint template design. This PowerPoint slide showcases four stages. It is useful to share insightful information on Homeschool Social Skills Statistics This PPT slide can be easily accessed in standard screen and widescreen aspect ratios. It is also available in various formats like PDF, PNG, and JPG. Not only this, the PowerPoint slideshow is completely editable and you can effortlessly modify the font size, font type, and shapes according to your wish. Our PPT layout is compatible with Google Slides as well, so download and edit it as per your knowledge.
-
Artificial intelligence key statistics ai ppt slides
Increase audience engagement and knowledge by dispensing information using Artificial Intelligence Key Statistics AI PPT Slides. This template helps you present information on three stages. You can also present information on Organization, Planning, Technology, Strategy using this PPT design. This layout is completely editable so personaize it now to meet your audiences expectations.
-
Regression Testing Statistics In Powerpoint And Google Slides Cpb
Presenting our Regression Testing Statistics In Powerpoint And Google Slides Cpb PowerPoint template design. This PowerPoint slide showcases four stages. It is useful to share insightful information on Regression Testing Statistics This PPT slide can be easily accessed in standard screen and widescreen aspect ratios. It is also available in various formats like PDF, PNG, and JPG. Not only this, the PowerPoint slideshow is completely editable and you can effortlessly modify the font size, font type, and shapes according to your wish. Our PPT layout is compatible with Google Slides as well, so download and edit it as per your knowledge.
-
Board Game Sales Statistics In Powerpoint And Google Slides Cpp
Presenting our Board Game Sales Statistics In Powerpoint And Google Slides Cpp PowerPoint template design. This PowerPoint slide showcases four stages. It is useful to share insightful information on Board Game Sales Statistics This PPT slide can be easily accessed in standard screen and widescreen aspect ratios. It is also available in various formats like PDF, PNG, and JPG. Not only this, the PowerPoint slideshow is completely editable and you can effortlessly modify the font size, font type, and shapes according to your wish. Our PPT layout is compatible with Google Slides as well, so download and edit it as per your knowledge.
-
Finance statistics percentage value powerpoint slide layout
Presenting finance statistics percentage value powerpoint slide layout. This is a finance statistics percentage value powerpoint slide layout. This is a three stage process. The stages in this process are technology, marketing, business, success, management.
-
6 month project timeline slide for standardization statistics infographic template
This is our 6 Month Project Timeline Slide For Standardization Statistics Infographic Template designed in PowerPoint, however, you can also access it in Google Slides. It comes in two aspect ratios standard and widescreen, with fully editable visual content.
-
8 circle slide for business statistics infographic template
Deploy our 8 Circle Slide For Business Statistics Infographic Template to present high quality presentations. It is designed in PowerPoint and is available for immediate download in standard and widescreen sizes. Not only this, but this layout is also 100 percent editable, giving you full control over its applications.
-
J curve powerpoint template slide
We are proud to present our j curve powerpoint template slide. J-Curve PowerPoint Template is a nice presentation chart template with a J-shaped diagram that you can edit to make a curve in PowerPoint with the J-Curve effect. J-Curve is widely used in several different fields to refer a situation where a curve initially falls but then rises to higher than the starting point. This is widely used in business presentations, private equity as well as other financial models.
-
Statistics Indicating Recurring OPEX PPT Slides AT
Step up your game with our enchanting Statistics Indicating Recurring OPEX PPT Slides AT deck, guaranteed to leave a lasting impression on your audience. Crafted with a perfect balance of simplicity, and innovation, our deck empowers you to alter it to your specific needs. You can also change the color theme of the slide to mold it to your companys specific needs. Save time with our ready-made design, compatible with Microsoft versions and Google Slides. Additionally, its available for download in various formats including JPG, JPEG, and PNG. Outshine your competitors with our fully editable and customized deck.