Powerpoint Templates for Statistical Data
Save time and engage your audience with our fully editable PowerPoint PPT Templates and Slides.
-

Economic Growth And Statistical Data Visualization PPT Structure AT
Ditch the Dull templates and opt for our engaging Economic Growth And Statistical Data Visualization PPT Structure AT deck to attract your audience. Our visually striking design effortlessly combines creativity with functionality, ensuring your content shines through. Compatible with Microsoft versions and Google Slides, it offers seamless integration of presentation. Save time and effort with our pre-designed PPT layout, while still having the freedom to customize fonts, colors, and everything you ask for. With the ability to download in various formats like JPG, JPEG, and PNG, sharing your slides has never been easier. From boardroom meetings to client pitches, this deck can be the secret weapon to leaving a lasting impression.
-

Fitting Outliers Statistical Data Analysis Anomaly PPT Template ST AI
Ditch the Dull templates and opt for our engaging Fitting Outliers Statistical Data Analysis Anomaly PPT Template ST AI deck to attract your audience. Our visually striking design effortlessly combines creativity with functionality, ensuring your content shines through. Compatible with Microsoft versions and Google Slides, it offers seamless integration of presentation. Save time and effort with our pre-designed PPT layout, while still having the freedom to customize fonts, colors, and everything you ask for. With the ability to download in various formats like JPG, JPEG, and PNG, sharing your slides has never been easier. From boardroom meetings to client pitches, this deck can be the secret weapon to leaving a lasting impression.
-
Variability Impact On Statistical Data Interpretation PPT Outline AT
Ditch the Dull templates and opt for our engaging Variability Impact On Statistical Data Interpretation PPT Outline AT deck to attract your audience. Our visually striking design effortlessly combines creativity with functionality, ensuring your content shines through. Compatible with Microsoft versions and Google Slides, it offers seamless integration of presentation. Save time and effort with our pre-designed PPT layout, while still having the freedom to customize fonts, colors, and everything you ask for. With the ability to download in various formats like JPG, JPEG, and PNG, sharing your slides has never been easier. From boardroom meetings to client pitches, this deck can be the secret weapon to leaving a lasting impression.
-
Statistical Data Analysis For Market Research PPT Slides AT
Ditch the Dull templates and opt for our engaging Statistical Data Analysis For Market Research PPT Slides AT deck to attract your audience. Our visually striking design effortlessly combines creativity with functionality, ensuring your content shines through. Compatible with Microsoft versions and Google Slides, it offers seamless integration of presentation. Save time and effort with our pre-designed PPT layout, while still having the freedom to customize fonts, colors, and everything you ask for. With the ability to download in various formats like JPG, JPEG, and PNG, sharing your slides has never been easier. From boardroom meetings to client pitches, this deck can be the secret weapon to leaving a lasting impression.
-
Choosing Visualization Methods For Statistical Data PPT Structure AT
Do not compromise on a template that erodes your messages impact. Introducing our engaging Choosing Visualization Methods For Statistical Data PPT Structure AT complete deck, thoughtfully crafted to grab your audiences attention instantly. With this deck, effortlessly download and adjust elements, streamlining the customization process. Whether you are using Microsoft versions or Google Slides, it fits seamlessly into your workflow. Furthermore, it is accessible in JPG, JPEG, PNG, and PDF formats, facilitating easy sharing and editing. Not only that you also play with the color theme of your slides making it suitable as per your audiences preference.
-
How To Conduct Effective Statistical Data Analysis PPT PowerPoint AT
Ditch the Dull templates and opt for our engaging How To Conduct Effective Statistical Data Analysis PPT PowerPoint AT deck to attract your audience. Our visually striking design effortlessly combines creativity with functionality, ensuring your content shines through. Compatible with Microsoft versions and Google Slides, it offers seamless integration of presentation. Save time and effort with our pre-designed PPT layout, while still having the freedom to customize fonts, colors, and everything you ask for. With the ability to download in various formats like JPG, JPEG, and PNG, sharing your slides has never been easier. From boardroom meetings to client pitches, this deck can be the secret weapon to leaving a lasting impression.
-
Statistical Data Types For Effective Data Science Analysis PPT Slides AT
Do not compromise on a template that erodes your messages impact. Introducing our engaging Statistical Data Types For Effective Data Science Analysis PPT Slides AT complete deck, thoughtfully crafted to grab your audiences attention instantly. With this deck, effortlessly download and adjust elements, streamlining the customization process. Whether you are using Microsoft versions or Google Slides, it fits seamlessly into your workflow. Furthermore, it is accessible in JPG, JPEG, PNG, and PDF formats, facilitating easy sharing and editing. Not only that you also play with the color theme of your slides making it suitable as per your audiences preference.
-
Statistical Data Analysis Techniques Explained Simply PPT Example AT
Step up your game with our enchanting Statistical Data Analysis Techniques Explained Simply PPT Example AT deck, guaranteed to leave a lasting impression on your audience. Crafted with a perfect balance of simplicity, and innovation, our deck empowers you to alter it to your specific needs. You can also change the color theme of the slide to mold it to your companys specific needs. Save time with our ready made design, compatible with Microsoft versions and Google Slides. Additionally, its available for download in various formats including JPG, JPEG, and PNG. Outshine your competitors with our fully editable and customized deck.
-
IQR Method Statistical Data Range Variability PPT Presentation ST AI
Dont compromise on a template that erodes your messages impact. Introducing our engaging IQR Method Statistical Data Range Variability PPT Presentation ST AI complete deck, thoughtfully crafted to grab your audiences attention instantly. With this deck, effortlessly download and adjust elements, streamlining the customization process. Whether youre using Microsoft versions or Google Slides, it fits seamlessly into your workflow. Furthermore, its accessible in JPG, JPEG, PNG, and PDF formats, facilitating easy sharing and editing. Not only that you also play with the color theme of your slides making it suitable as per your audiences preference.
-
Top Statistics For Data PPT Guidelines AT
While your presentation may contain top-notch content, if it lacks visual appeal, you are not fully engaging your audience. Introducing our Top Statistics For Data PPT Guidelines AT deck, designed to engage your audience. Our complete deck boasts a seamless blend of Creativity and versatility. You can effortlessly customize elements and color schemes to align with your brand identity. Save precious time with our pre-designed template, compatible with Microsoft versions and Google Slides. Plus, its downloadable in multiple formats like JPG, JPEG, and PNG. Elevate your presentations and outshine your competitors effortlessly with our visually stunning 100 percent editable deck.
-
Statistical Data Analysis Simplified For Beginners PPT Sample AT
Ditch the Dull templates and opt for our engaging Statistical Data Analysis Simplified For Beginners PPT Sample AT deck to attract your audience. Our visually striking design effortlessly combines creativity with functionality, ensuring your content shines through. Compatible with Microsoft versions and Google Slides, it offers seamless integration of presentation. Save time and effort with our pre-designed PPT layout, while still having the freedom to customize fonts, colors, and everything you ask for. With the ability to download in various formats like JPG, JPEG, and PNG, sharing your slides has never been easier. From boardroom meetings to client pitches, this deck can be the secret weapon to leaving a lasting impression.
-
Different Types Of Statistical Data Summary PPT Structure AT
While your presentation may contain top-notch content, if it lacks visual appeal, you are not fully engaging your audience. Introducing our Different Types Of Statistical Data Summary PPT Structure AT deck, designed to engage your audience. Our complete deck boasts a seamless blend of Creativity and versatility. You can effortlessly customize elements and color schemes to align with your brand identity. Save precious time with our pre-designed template, compatible with Microsoft versions and Google Slides. Plus, its downloadable in multiple formats like JPG, JPEG, and PNG. Elevate your presentations and outshine your competitors effortlessly with our visually stunning 100 percent editable deck.
-
Hypothesis Testing In Statistical Data Analysis Explained PPT Presentation AT
Ditch the Dull templates and opt for our engaging Hypothesis Testing In Statistical Data Analysis Explained PPT Presentation AT deck to attract your audience. Our visually striking design effortlessly combines creativity with functionality, ensuring your content shines through. Compatible with Microsoft versions and Google Slides, it offers seamless integration of presentation. Save time and effort with our pre-designed PPT layout, while still having the freedom to customize fonts, colors, and everything you ask for. With the ability to download in various formats like JPG, JPEG, and PNG, sharing your slides has never been easier. From boardroom meetings to client pitches, this deck can be the secret weapon to leaving a lasting impression.
-
How To Collect And Analyze Statistical Data Effectively PPT Outline AT
While your presentation may contain top notch content, if it lacks visual appeal, you are not fully engaging your audience. Introducing our How To Collect And Analyze Statistical Data Effectively PPT Outline AT deck, designed to engage your audience. Our complete deck boasts a seamless blend of Creativity and versatility. You can effortlessly customize elements and color schemes to align with your brand identity. Save precious time with our pre designed template, compatible with Microsoft versions and Google Slides. Plus, its downloadable in multiple formats like JPG, JPEG, and PNG. Elevate your presentations and outshine your competitors effortlessly with our visually stunning 100 percent editable deck.
-
Statistical Data Visualization Graphs And Trends PPT Demonstration AT
Do not compromise on a template that erodes your messages impact. Introducing our engaging Statistical Data Visualization Graphs And Trends PPT Demonstration AT complete deck, thoughtfully crafted to grab your audiences attention instantly. With this deck, effortlessly download and adjust elements, streamlining the customization process. Whether you are using Microsoft versions or Google Slides, it fits seamlessly into your workflow. Furthermore, it is accessible in JPG, JPEG, PNG, and PDF formats, facilitating easy sharing and editing. Not only that you also play with the color theme of your slides making it suitable as per your audiences preference.
-
Introduction To Statistical Data Visualization PPT Information AT
Step up your game with our enchanting Introduction To Statistical Data Visualization PPT Information AT deck, guaranteed to leave a lasting impression on your audience. Crafted with a perfect balance of simplicity, and innovation, our deck empowers you to alter it to your specific needs. You can also change the color theme of the slide to mold it to your companys specific needs. Save time with our ready-made design, compatible with Microsoft versions and Google Slides. Additionally, its available for download in various formats including JPG, JPEG, and PNG. Outshine your competitors with our fully editable and customized deck.
-
Four Types Of Statistical Data Classification PPT Structure AT
Do not compromise on a template that erodes your messages impact. Introducing our engaging Four Types Of Statistical Data Classification PPT Structure AT complete deck, thoughtfully crafted to grab your audiences attention instantly. With this deck, effortlessly download and adjust elements, streamlining the customization process. Whether you are using Microsoft versions or Google Slides, it fits seamlessly into your workflow. Furthermore, it is accessible in JPG, JPEG, PNG, and PDF formats, facilitating easy sharing and editing. Not only that you also play with the color theme of your slides making it suitable as per your audiences preference.
-
Practical Statistical Data Types Research PPT Demonstration AT
Step up your game with our enchanting Practical Statistical Data Types Research PPT Demonstration AT deck, guaranteed to leave a lasting impression on your audience. Crafted with a perfect balance of simplicity, and innovation, our deck empowers you to alter it to your specific needs. You can also change the color theme of the slide to mold it to your companys specific needs. Save time with our ready-made design, compatible with Microsoft versions and Google Slides. Additionally, its available for download in various formats including JPG, JPEG, and PNG. Outshine your competitors with our fully editable and customized deck.
-
How To Collect And Organize Statistical Data Effectively PPT Outline AT
Step up your game with our enchanting How To Collect And Organize Statistical Data Effectively PPT Outline AT deck, guaranteed to leave a lasting impression on your audience. Crafted with a perfect balance of simplicity, and innovation, our deck empowers you to alter it to your specific needs. You can also change the color theme of the slide to mold it to your companys specific needs. Save time with our ready-made design, compatible with Microsoft versions and Google Slides. Additionally, its available for download in various formats including JPG, JPEG, and PNG. Outshine your competitors with our fully editable and customized deck.
-
Three Emerging Workplace Trends Statistical Data PPT Graphics AT
Step up your game with our enchanting Three Emerging Workplace Trends Statistical Data PPT Graphics AT deck, guaranteed to leave a lasting impression on your audience. Crafted with a perfect balance of simplicity, and innovation, our deck empowers you to alter it to your specific needs. You can also change the color theme of the slide to mold it to your companys specific needs. Save time with our ready made design, compatible with Microsoft versions and Google Slides. Additionally, its available for download in various formats including JPG, JPEG, and PNG. Outshine your competitors with our fully editable and customized deck.
-
How To Conduct Effective Statistical Data Analysis PPT Example AT
Ditch the Dull templates and opt for our engaging How To Conduct Effective Statistical Data Analysis PPT Example AT deck to attract your audience. Our visually striking design effortlessly combines creativity with functionality, ensuring your content shines through. Compatible with Microsoft versions and Google Slides, it offers seamless integration of presentation. Save time and effort with our pre-designed PPT layout, while still having the freedom to customize fonts, colors, and everything you ask for. With the ability to download in various formats like JPG, JPEG, and PNG, sharing your slides has never been easier. From boardroom meetings to client pitches, this deck can be the secret weapon to leaving a lasting impression.
-
Primary Data Statistics Analysis PPT Information AT
Step up your game with our enchanting Primary Data Statistics Analysis PPT Information AT deck, guaranteed to leave a lasting impression on your audience. Crafted with a perfect balance of simplicity, and innovation, our deck empowers you to alter it to your specific needs. You can also change the color theme of the slide to mold it to your companys specific needs. Save time with our ready-made design, compatible with Microsoft versions and Google Slides. Additionally, its available for download in various formats including JPG, JPEG, and PNG. Outshine your competitors with our fully editable and customized deck.
-
Statistical Analysis For Data Driven Decision Making PPT Information AT
Step up your game with our enchanting Statistical Analysis For Data Driven Decision Making PPT Information AT deck, guaranteed to leave a lasting impression on your audience. Crafted with a perfect balance of simplicity, and innovation, our deck empowers you to alter it to your specific needs. You can also change the color theme of the slide to mold it to your companys specific needs. Save time with our ready-made design, compatible with Microsoft versions and Google Slides. Additionally, its available for download in various formats including JPG, JPEG, and PNG. Outshine your competitors with our fully editable and customized deck.
-
Understanding Nominal And Ordinal Statistical Data Types PPT Slides AT
Do not compromise on a template that erodes your messages impact. Introducing our engaging Understanding Nominal And Ordinal Statistical Data Types PPT Slides AT complete deck, thoughtfully crafted to grab your audiences attention instantly. With this deck, effortlessly download and adjust elements, streamlining the customization process. Whether you are using Microsoft versions or Google Slides, it fits seamlessly into your workflow. Furthermore, it is accessible in JPG, JPEG, PNG, and PDF formats, facilitating easy sharing and editing. Not only that you also play with the color theme of your slides making it suitable as per your audiences preference.
-
How To Calculate Range Of Statistical Data Sets PPT PowerPoint AT
While your presentation may contain top notch content, if it lacks visual appeal, you are not fully engaging your audience. Introducing our How To Calculate Range Of Statistical Data Sets PPT PowerPoint AT deck, designed to engage your audience. Our complete deck boasts a seamless blend of Creativity and versatility. You can effortlessly customize elements and color schemes to align with your brand identity. Save precious time with our pre designed template, compatible with Microsoft versions and Google Slides. Plus, its downloadable in multiple formats like JPG, JPEG, and PNG. Elevate your presentations and outshine your competitors effortlessly with our visually stunning 100 percent editable deck.
-
Latest Data Statistics Overview And Insights PPT Guidelines AT
Step up your game with our enchanting Latest Data Statistics Overview And Insights PPT Guidelines AT deck, guaranteed to leave a lasting impression on your audience. Crafted with a perfect balance of simplicity, and innovation, our deck empowers you to alter it to your specific needs. You can also change the color theme of the slide to mold it to your companys specific needs. Save time with our ready-made design, compatible with Microsoft versions and Google Slides. Additionally, its available for download in various formats including JPG, JPEG, and PNG. Outshine your competitors with our fully editable and customized deck.
-
1013 business ppt diagram 10 stages statistical data powerpoint template
We are proud to present our 1013 business ppt diagram 10 stages statistical data powerpoint template. Use Our Concepts Power Point Templates In Concert. Create A Masterful Melody With Your Ideas. Light A Fire With Our Shapes Power Point Templates. Spread The Warmth Of Your Ideas.
-
Statistical Data For Safety Training Communications
This slide describes the statistical data for safety training methods to understand the safety communications such as days millions, etc. Presenting our well structured Statistical Data For Safety Training Communications. The topics discussed in this slide are Communications, Statistical, Occupations. This is an instantly available PowerPoint presentation that can be edited conveniently. Download it right away and captivate your audience.
-
Statistical Data For Email Marketing Metrics Optimizing Growth With Marketing CRP DK SS
This slide illustrates statistical data for top-performing email marketing metrics to understand the significance of each factor. Deliver an outstanding presentation on the topic using this Statistical Data For Email Marketing Metrics Optimizing Growth With Marketing CRP DK SS. Dispense information and present a thorough explanation of Delivery Rate, Conversion Rate, Subsrciber List Rate using the slides given. This template can be altered and personalized to fit your needs. It is also available for immediate download. So grab it now.
-
Categorize Cyber Incident Report Template Using Statistical Data
This slide illustrates cyber incident report template data for mitigating security threats and proper implementation by cyber incident reporting teams. It includes aspects such as growth drivers, opportunities and contributing factors. Introducing our Categorize Cyber Incident Report Template Using Statistical Data set of slides. The topics discussed in these slides are Growth Drivers, Opportunities, Contributing Factors. This is an immediately available PowerPoint presentation that can be conveniently customized. Download it and convince your audience.
-
Agricultural Automation Market Forecast Statistical Data
This slide depicts market size of farming transformation and provides details about agriculture automation forecasting in near future. It includes elements such as AI, awareness, etc. Introducing our Agricultural Automation Market Forecast Statistical Data set of slides. The topics discussed in these slides are Key Drivers, Key Players. This is an immediately available PowerPoint presentation that can be conveniently customized. Download it and convince your audience.
-
Statistical Data Highlighting Emerging Trends In SMS Marketing Overview Of SMS Marketing
This slide shows details related to statistical insights and trends in SMS marketing. It includes details related to channels preferred by customers for receiving brand updates, state of SMS business use etc. Present the topic in a bit more detail with this Statistical Data Highlighting Emerging Trends In SMS Marketing Overview Of SMS Marketing. Use it as a tool for discussion and navigation on Texting For Customer Engagement. This template is free to edit as deemed fit for your organization. Therefore download it now.
-
Data And Statistical Analysis PPT Summary VA
Dive into the world of data and statistical analysis with our expertly crafted PowerPoint template designed for clarity and impact. This presentation deck not only simplifies complex information but also enhances your visual storytelling capabilities. Engaging charts sophisticated infographic templates and expertly designed editable slides allow you to convey vital insights effortlessly. Perfect for corporate presentations or consulting discussions this collection includes modern slide designs and animated presentation options to captivate your audience. Whether youre presenting a strategy deck or crafting a compelling pitch to investors elevate your data narrative with our unique approach ensuring that every statistic resonates with clarity.
-
Global Tiktok Users Statistical Data Tiktok Marketing Campaign To Increase
This slide shows the statistical data representing the analysis of global TikTok users on TikTok to help marketers to analyze and identify target audience. It shows data related to users of TikTok are youths and millennials.Present the topic in a bit more detail with this Global Tiktok Users Statistical Data Tiktok Marketing Campaign To Increase. Use it as a tool for discussion and navigation on Global Tiktok Users, Statistical Data. This template is free to edit as deemed fit for your organization. Therefore download it now.
-
Improve Statistics For Better Data Analysis PPT Sample AT
Ditch the Dull templates and opt for our engaging Improve Statistics For Better Data Analysis PPT Sample AT deck to attract your audience. Our visually striking design effortlessly combines creativity with functionality, ensuring your content shines through. Compatible with Microsoft versions and Google Slides, it offers seamless integration of presentation. Save time and effort with our pre-designed PPT layout, while still having the freedom to customize fonts, colors, and everything you ask for. With the ability to download in various formats like JPG, JPEG, and PNG, sharing your slides has never been easier. From boardroom meetings to client pitches, this deck can be the secret weapon to leaving a lasting impression.
-
Purchase Price Variance Statistical Data For Trend Analysis
This slide demonstrates purchase price variance data for proactive and strategic approach to manage costs, optimize procurement process for overall financial health. It includes basis such as growth drivers, opportunities available and contributing factors. Introducing our Purchase Price Variance Statistical Data For Trend Analysis set of slides. The topics discussed in these slides are Monthly Purchase, Variance Graph, Trend Analysis This is an immediately available PowerPoint presentation that can be conveniently customized. Download it and convince your audience.
-
Statistical Analysis Techniques Working Of Descriptive Statistical Data Analysis
This slide represents the working process of descriptive statistical analysis. The steps involved in performing descriptive statistical analysis are define business metrics, identify required data, extract and preprocess data, data analysis, and data presentation. Introducing Statistical Analysis Techniques Working Of Descriptive Statistical Data Analysis to increase your presentation threshold. Encompassed with Five stages, this template is a great option to educate and entice your audience. Dispence information on Business Metrics, Required Data, Extract And Preprocess Data, Data Analysis, using this template. Grab it now to reap its full benefits.
-
Statistics For Data Analysis PPT Template AT
While your presentation may contain top-notch content, if it lacks visual appeal, you are not fully engaging your audience. Introducing our Statistics For Data Analysis PPT Template AT deck, designed to engage your audience. Our complete deck boasts a seamless blend of Creativity and versatility. You can effortlessly customize elements and color schemes to align with your brand identity. Save precious time with our pre-designed template, compatible with Microsoft versions and Google Slides. Plus, its downloadable in multiple formats like JPG, JPEG, and PNG. Elevate your presentations and outshine your competitors effortlessly with our visually stunning 100 percent editable deck.
-
Statistical Analysis Techniques Timeline To Conduct Statistical Data Analysis
This slide shows the timeline for performing statistical data analysis. The key steps include writing hypothesis and plan research design, collect data from a sample, summarize data with descriptive statistics, test hypotheses, result interpretation, etc. Introducing Statistical Analysis Techniques Timeline To Conduct Statistical Data Analysis to increase your presentation threshold. Encompassed with Five stages, this template is a great option to educate and entice your audience. Dispence information on Plan Research Design, Test Hypotheses, Result Interpretation, using this template. Grab it now to reap its full benefits.
-
Statistical Data Highlighting Invisible Banking A Megatrend Transformation Ppt Template
This slide presents statistics illustrating the projected increase in the number of IoT devices connected in the upcoming years. This growth is attributed to enhanced mobile connectivity and the availability of cost effective sensors.Present the topic in a bit more detail with this Statistical Data Highlighting Invisible Banking A Megatrend Transformation Ppt Template. Use it as a tool for discussion and navigation on Statistical Data Highlighting, Enhanced Mobile Connectivity, Cost Effective Sensors. This template is free to edit as deemed fit for your organization. Therefore download it now.
-
Log Statistical Data Analytic Icon
Introducing our Log Statistical Data Analytic Icon set of slides.The topics discussed in these slides are Log Statistical Data, Analytic Icon.This is an immediately available PowerPoint presentation that can be conveniently customized.Download it and convince your audience.
-
Mastering EDA Statistical And Data Visualization PPT Example AT
While your presentation may contain top-notch content, if it lacks visual appeal, you are not fully engaging your audience. Introducing our Mastering EDA Statistical And Data Visualization PPT Example AT deck, designed to engage your audience. Our complete deck boasts a seamless blend of Creativity and versatility. You can effortlessly customize elements and color schemes to align with your brand identity. Save precious time with our pre-designed template, compatible with Microsoft versions and Google Slides. Plus, its downloadable in multiple formats like JPG, JPEG, and PNG. Elevate your presentations and outshine your competitors effortlessly with our visually stunning 100 percent editable deck.
-
Common Statistical Methods For Data Analysis PPT Summary AT
Ditch the Dull templates and opt for our engaging Common Statistical Methods For Data Analysis PPT Summary AT deck to attract your audience. Our visually striking design effortlessly combines creativity with functionality, ensuring your content shines through. Compatible with Microsoft versions and Google Slides, it offers seamless integration of presentation. Save time and effort with our pre-designed PPT layout, while still having the freedom to customize fonts, colors, and everything you ask for. With the ability to download in various formats like JPG, JPEG, and PNG, sharing your slides has never been easier. From boardroom meetings to client pitches, this deck can be the secret weapon to leaving a lasting impression.
-
Statistical Analysis For Data Driven Timeline To Conduct Statistical Data Analysis
This slide shows the timeline for performing statistical data analysis. The key steps include writing hypothesis and plan research design, collect data from a sample, summarize data with descriptive statistics, test hypotheses, result interpretation, etc. Introducing Statistical Analysis For Data Driven Timeline To Conduct Statistical Data Analysis to increase your presentation threshold. Encompassed with five stages, this template is a great option to educate and entice your audience. Dispence information on Statistical Data Analysis, Test Hypotheses, Result Interpretation, Plan Research Design, using this template. Grab it now to reap its full benefits.
-
Statistical Data Analysis Strategies For Machine Learning
This slide highlights statistical data analysis planning for machine learning. The purpose of this template is to provide methods for implementing statistical data analysis. The methods include linear regression, classification, resampling, tree-based and unsupervised learning. Introducing our premium set of slides with Statistical Data Analysis Strategies For Machine Learning. Ellicudate the five stages and present information using this PPT slide. This is a completely adaptable PowerPoint template design that can be used to interpret topics like Linear Regression, Tree Based Method, Classification. So download instantly and tailor it with your information.
-
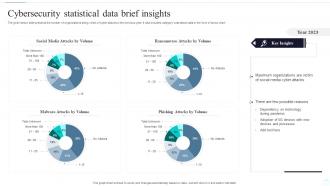
Cybersecurity Statistical Data Brief Insights
The given below slide presents the number of organizations being victim of cyber attacks in the previous year. It also includes category wise attack data in the form of donut chart. Presenting our well structured Cybersecurity Statistical Data Brief Insights. The topics discussed in this slide are Social Media, Phishing Attacks, Malware Attacks. This is an instantly available PowerPoint presentation that can be edited conveniently. Download it right away and captivate your audience.
-
Using Statistics To Make Data Driven Business Decisions PPT Sample AT
Ditch the Dull templates and opt for our engaging Using Statistics To Make Data Driven Business Decisions PPT Sample AT deck to attract your audience. Our visually striking design effortlessly combines creativity with functionality, ensuring your content shines through. Compatible with Microsoft versions and Google Slides, it offers seamless integration of presentation. Save time and effort with our pre-designed PPT layout, while still having the freedom to customize fonts, colors, and everything you ask for. With the ability to download in various formats like JPG, JPEG, and PNG, sharing your slides has never been easier. From boardroom meetings to client pitches, this deck can be the secret weapon to leaving a lasting impression.
-
Descriptive Statistics Data Summary PPT Outline AT
Ditch the Dull templates and opt for our engaging Descriptive Statistics Data Summary PPT Outline AT deck to attract your audience. Our visually striking design effortlessly combines creativity with functionality, ensuring your content shines through. Compatible with Microsoft versions and Google Slides, it offers seamless integration of presentation. Save time and effort with our pre designed PPT layout, while still having the freedom to customize fonts, colors, and everything you ask for. With the ability to download in various formats like JPG, JPEG, and PNG, sharing your slides has never been easier. From boardroom meetings to client pitches, this deck can be the secret weapon to leaving a lasting impression.
-
Primary Data Statistical Methods Toolkit PPT PowerPoint AT
Do not compromise on a template that erodes your messages impact. Introducing our engaging Primary Data Statistical Methods Toolkit PPT PowerPoint AT complete deck, thoughtfully crafted to grab your audiences attention instantly. With this deck, effortlessly download and adjust elements, streamlining the customization process. Whether you are using Microsoft versions or Google Slides, it fits seamlessly into your workflow. Furthermore, it is accessible in JPG, JPEG, PNG, and PDF formats, facilitating easy sharing and editing. Not only that you also play with the color theme of your slides making it suitable as per your audiences preference.
-
Statistical Analysis For Data Driven Decision Making Powerpoint Presentation Slides
Deliver an informational PPT on various topics by using this Statistical Analysis For Data Driven Decision Making Powerpoint Presentation Slides. This deck focuses and implements best industry practices, thus providing a birds-eye view of the topic. Encompassed with seventy one slides, designed using high-quality visuals and graphics, this deck is a complete package to use and download. All the slides offered in this deck are subjective to innumerable alterations, thus making you a pro at delivering and educating. You can modify the color of the graphics, background, or anything else as per your needs and requirements. It suits every business vertical because of its adaptable layout.
-
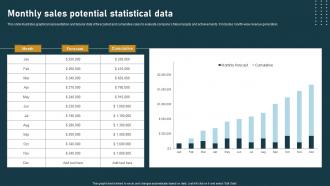
Monthly Sales Potential Statistical Data
This slide illustrates graphical representation and tabular data of forecasted and cumulative sales to evaluate companys future targets and achievements. It includes month-wise revenue generation. Introducing our Monthly Sales Potential Statistical Data set of slides. The topics discussed in these slides are Monthly Sales, Potential, Statistical Data. This is an immediately available PowerPoint presentation that can be conveniently customized. Download it and convince your audience.
-
Statistical Techniques For Data Analysis PPT Guidelines AT
Ditch the Dull templates and opt for our engaging Statistical Techniques For Data Analysis PPT Guidelines AT deck to attract your audience. Our visually striking design effortlessly combines creativity with functionality, ensuring your content shines through. Compatible with Microsoft versions and Google Slides, it offers seamless integration of presentation. Save time and effort with our pre-designed PPT layout, while still having the freedom to customize fonts, colors, and everything you ask for. With the ability to download in various formats like JPG, JPEG, and PNG, sharing your slides has never been easier. From boardroom meetings to client pitches, this deck can be the secret weapon to leaving a lasting impression.
-
Statistical Inference Data Analysis PPT Template AT
While your presentation may contain top notch content, if it lacks visual appeal, you are not fully engaging your audience. Introducing our Statistical Inference Data Analysis PPT Template AT deck, designed to engage your audience. Our complete deck boasts a seamless blend of Creativity and versatility. You can effortlessly customize elements and color schemes to align with your brand identity. Save precious time with our pre designed template, compatible with Microsoft versions and Google Slides. Plus, its downloadable in multiple formats like JPG, JPEG, and PNG. Elevate your presentations and outshine your competitors effortlessly with our visually stunning 100 percent editable deck.
-
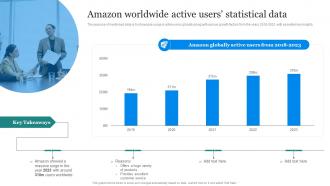
Amazon Marketing Strategy Amazon Worldwide Active Users Statistical Data
The purpose of mentioned slide is to showcase surge in active users globally along with various growth factors from the years 2018 2023 with essential key insights. Deliver an outstanding presentation on the topic using this Amazon Marketing Strategy Amazon Worldwide Active Users Statistical Data. Dispense information and present a thorough explanation of Worldwide, Statistical Data, Massive Surge, Excellent Customer Service using the slides given. This template can be altered and personalized to fit your needs. It is also available for immediate download. So grab it now.
-
Instagram Usage Key Demographics Statistical Data Instagram Advertising To Enhance
This slide represents the statistical data showcasing the demographics of Instagram users. It includes details related to demographics such as gender, age, location, income and education levels of individuals. Deliver an outstanding presentation on the topic using this Instagram Usage Key Demographics Statistical Data Instagram Advertising To Enhance. Dispense information and present a thorough explanation of Instagram Usage, Demographics, Statistical Data using the slides given. This template can be altered and personalized to fit your needs. It is also available for immediate download. So grab it now.
-
Big Data Statistical Analysis PPT Template VA
Unlock the potential of your data narrative with our Big Data Statistical Analysis PPT Template. This cuttingedge presentation deck blends modern slide design with powerful data visualization tools allowing you to present your insights in a visually engaging manner. Featuring editable slides and infographic templates each element is crafted to enhance your storytelling whether youre addressing stakeholders in a corporate presentation or sharing findings during a consulting session. The easytonavigate layout ensures that your audience grasps complex statistical insights effortlessly. Propel your ideas forward and captivate your viewers with this essential resource for impactful presentations.
-
Statistical Reasoning Analyze Data Confidently PPT Presentation AT
While your presentation may contain top-notch content, if it lacks visual appeal, you are not fully engaging your audience. Introducing our Statistical Reasoning Analyze Data Confidently PPT Presentation AT deck, designed to engage your audience. Our complete deck boasts a seamless blend of Creativity and versatility. You can effortlessly customize elements and color schemes to align with your brand identity. Save precious time with our pre-designed template, compatible with Microsoft versions and Google Slides. Plus, its downloadable in multiple formats like JPG, JPEG, and PNG. Elevate your presentations and outshine your competitors effortlessly with our visually stunning 100 percent editable deck.
-
Statistical Tests For Data Analysis Essentials PPT Graphics AT
Do not compromise on a template that erodes your messages impact. Introducing our engaging Statistical Tests For Data Analysis Essentials PPT Graphics AT complete deck, thoughtfully crafted to grab your audiences attention instantly. With this deck, effortlessly download and adjust elements, streamlining the customization process. Whether you are using Microsoft versions or Google Slides, it fits seamlessly into your workflow. Furthermore, it is accessible in JPG, JPEG, PNG, and PDF formats, facilitating easy sharing and editing. Not only that you also play with the color theme of your slides making it suitable as per your audiences preference.
-
Statistical Data Highlighting Gaming Industry Market Size
Following slide shows global industry analysis data to understand factors and areas that results in expansion and growth in gaming industry market. It include elements such as key players, market size growth rate, regional analysis and end user segment overview. Introducing our Statistical Data Highlighting Gaming Industry Market Size set of slides. The topics discussed in these slides are Statistical, Segment Overview, Expansion. This is an immediately available PowerPoint presentation that can be conveniently customized. Download it and convince your audience.
-
Cybersecurity Awareness Training Statistical Data Across Industries
This slide covers cybersecurity awareness training statistical data across industries. It involves impact of cybersecurity training across different industries such as banking, healthcare, IT, telecom and manufacturing. Introducing our Cybersecurity Awareness Training Statistical Data Across Industries set of slides. The topics discussed in these slides are Cybersecurity Awareness Training, Statistical Data Across, Industries. This is an immediately available PowerPoint presentation that can be conveniently customized. Download it and convince your audience.