

Powerpoint Templates for Statistical Data
Save time and engage your audience with our fully editable PowerPoint PPT Templates and Slides.
-

Global Statistical Report Of Data Center As A Service
This slide presents global industry outlook for data center as a service model which will assist information technology organizations to leverage their investments and improve service performance. The verticals investing in this sector are retail, healthcare, manufacturing etc. Presenting our well structured Global Statistical Report Of Data Center As A Service. The topics discussed in this slide are Highest Revenue, Telecom Segment, Key Takeaways. This is an instantly available PowerPoint presentation that can be edited conveniently. Download it right away and captivate your audience.
-

Statistical Analysis Big Data Monotone Icon In Powerpoint Pptx Png And Editable Eps Format
This Monotone Powerpoint Icon is perfect for Analysis Presentation. It features a graph with a magnifying glass, emphasizing the importance of data analysis. It is a great visual aid to help you convey your message and is sure to impress your audience.
-
Data Environment Statistical Analysis Monotone Icon In Powerpoint Pptx Png And Editable Eps Format
Make your presentation profoundly eye-catching leveraging our easily customizable Data environment statistical analysis monotone icon in powerpoint pptx png and editable eps format. It is designed to draw the attention of your audience. Available in all editable formats, including PPTx, png, and eps, you can tweak it to deliver your message with ease.
-
Big Data Healthcare Statistical Analysis In Powerpoint And Google Slides Cpb
Presenting our Big Data Healthcare Statistical Analysis In Powerpoint And Google Slides Cpb PowerPoint template design. This PowerPoint slide showcases four stages. It is useful to share insightful information on Big Data Healthcare Statistical Analysis This PPT slide can be easily accessed in standard screen and widescreen aspect ratios. It is also available in various formats like PDF, PNG, and JPG. Not only this, the PowerPoint slideshow is completely editable and you can effortlessly modify the font size, font type, and shapes according to your wish. Our PPT layout is compatible with Google Slides as well, so download and edit it as per your knowledge.
-
Statistical Analysis Big Data Colored Icon In Powerpoint Pptx Png And Editable Eps Format
This colourful PowerPoint icon is perfect for any Analysis Presentation. It features a colourful chart with a magnifying glass, representing the analysis process. Its a great visual aid to help explain complex data and can be easily edited to fit any presentation.
-
Statistical methods evaluation data analytics ppt powerpoint presentation layouts influencers cpb
Presenting our Statistical Methods Evaluation Data Analytics Ppt Powerpoint Presentation Layouts Influencers Cpb PowerPoint template design. This PowerPoint slide showcases four stages. It is useful to share insightful information on Statistical Methods Evaluation Data Analytics. This PPT slide can be easily accessed in standard screen and widescreen aspect ratios. It is also available in various formats like PDF, PNG, and JPG. Not only this, the PowerPoint slideshow is completely editable and you can effortlessly modify the font size, font type, and shapes according to your wish. Our PPT layout is compatible with Google Slides as well, so download and edit it as per your knowledge.
-
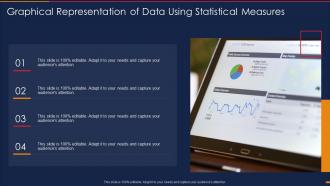
Graphical representation of data using statistical measures
Introducing our premium set of slides with Graphical Representation Of Data Using Statistical Measures. Elucidate the four stages and present information using this PPT slide. This is a completely adaptable PowerPoint template design that can be used to interpret topics like Graphical Representation Of Data Using Statistical Measures. So download instantly and tailor it with your information.
-
Corporate data with statistical analysis presentation slide
Presenting corporate data with statistical analysis presentation slide. This is a corporate data with statistical analysis presentation slide. This is a six stage process. The stages in this process are control, one dollar, twenty dollars, lower bound, upper bound.
-
Data driven statistical analysis powerpoint template
Presenting data driven statistical analysis powerpoint template. Presenting data driven statistical analysis powerpoint template. Presenting data driven statistical analysis powerpoint template. Presenting data driven statistical analysis powerpoint template. Presenting data driven statistical analysis powerpoint template. This is a data driven statistical analysis powerpoint template. This is a six stage process. The stages in this process are data driven, statistical, analysis, condition, control, twenty dollars, one dollar.
-
Quantitative data analysis statistical analysis methods personal professional development cpb
Presenting this set of slides with name - Quantitative Data Analysis Statistical Analysis Methods Personal Professional Development Cpb. This is an editable three stages graphic that deals with topics like Quantitative Data Analysis, Statistical Analysis Methods, Personal Professional Development to help convey your message better graphically. This product is a premium product available for immediate download, and is 100 percent editable in Powerpoint. Download this now and use it in your presentations to impress your audience.
-
Data mining statistical analysis ppt powerpoint presentation slides graphics cpb
Presenting this set of slides with name Data Mining Statistical Analysis Ppt Powerpoint Presentation Slides Graphics Cpb. This is an editable Powerpoint three stages graphic that deals with topics like Data Mining Statistical Analysis to help convey your message better graphically. This product is a premium product available for immediate download and is 100 percent editable in Powerpoint. Download this now and use it in your presentations to impress your audience.
-
Statistical Techniques For Quantitative Data Analysis Explained PPT Slides AT
Do not compromise on a template that erodes your messages impact. Introducing our engaging Statistical Techniques For Quantitative Data Analysis Explained PPT Slides AT complete deck, thoughtfully crafted to grab your audiences attention instantly. With this deck, effortlessly download and adjust elements, streamlining the customization process. Whether you are using Microsoft versions or Google Slides, it fits seamlessly into your workflow. Furthermore, it is accessible in JPG, JPEG, PNG, and PDF formats, facilitating easy sharing and editing. Not only that you also play with the color theme of your slides making it suitable as per your audiences preference.
-
Visualizing Data Trends With Statistical Analysis Tools PPT Sample AT
While your presentation may contain top-notch content, if it lacks visual appeal, you are not fully engaging your audience. Introducing our Visualizing Data Trends With Statistical Analysis Tools PPT Sample AT deck, designed to engage your audience. Our complete deck boasts a seamless blend of Creativity and versatility. You can effortlessly customize elements and color schemes to align with your brand identity. Save precious time with our pre-designed template, compatible with Microsoft versions and Google Slides. Plus, its downloadable in multiple formats like JPG, JPEG, and PNG. Elevate your presentations and outshine your competitors effortlessly with our visually stunning 100 percent editable deck.
-
Harnessing Statistical Methods To Enhance Data Integrity PPT Designs ACP
While your presentation may contain top-notch content, if it lacks visual appeal, you are not fully engaging your audience. Introducing our Harnessing Statistical Methods To Enhance Data Integrity PPT Designs ACP deck, designed to engage your audience. Our complete deck boasts a seamless blend of Creativity and versatility. You can effortlessly customize elements and color schemes to align with your brand identity. Save precious time with our pre-designed template, compatible with Microsoft versions and Google Slides. Plus, its downloadable in multiple formats like JPG, JPEG, and PNG. Elevate your presentations and outshine your competitors effortlessly with our visually stunning 100 percent editable deck.
-
Statistical Methods For Identifying Data Anomalies PPT PowerPoint AT
Step up your game with our enchanting Statistical Methods For Identifying Data Anomalies PPT PowerPoint AT deck, guaranteed to leave a lasting impression on your audience. Crafted with a perfect balance of simplicity, and innovation, our deck empowers you to alter it to your specific needs. You can also change the color theme of the slide to mold it to your companys specific needs. Save time with our ready made design, compatible with Microsoft versions and Google Slides. Additionally, its available for download in various formats including JPG, JPEG, and PNG. Outshine your competitors with our fully editable and customized deck.
-
Statistical Methods For Stability Data Evaluation PPT Sample AT
Ditch the Dull templates and opt for our engaging Statistical Methods For Stability Data Evaluation PPT Sample AT deck to attract your audience. Our visually striking design effortlessly combines creativity with functionality, ensuring your content shines through. Compatible with Microsoft versions and Google Slides, it offers seamless integration of presentation. Save time and effort with our pre designed PPT layout, while still having the freedom to customize fonts, colors, and everything you ask for. With the ability to download in various formats like JPG, JPEG, and PNG, sharing your slides has never been easier. From boardroom meetings to client pitches, this deck can be the secret weapon to leaving a lasting impression.
-
Top Statistical Software Tools For Data Analysis PPT Example AT
Step up your game with our enchanting Top Statistical Software Tools For Data Analysis PPT Example AT deck, guaranteed to leave a lasting impression on your audience. Crafted with a perfect balance of simplicity, and innovation, our deck empowers you to alter it to your specific needs. You can also change the color theme of the slide to mold it to your companys specific needs. Save time with our ready-made design, compatible with Microsoft versions and Google Slides. Additionally, its available for download in various formats including JPG, JPEG, and PNG. Outshine your competitors with our fully editable and customized deck.
-
Statistical Techniques For Analyzing Data Insights PPT Mockup AT
Ditch the Dull templates and opt for our engaging Statistical Techniques For Analyzing Data Insights PPT Mockup AT deck to attract your audience. Our visually striking design effortlessly combines creativity with functionality, ensuring your content shines through. Compatible with Microsoft versions and Google Slides, it offers seamless integration of presentation. Save time and effort with our pre-designed PPT layout, while still having the freedom to customize fonts, colors, and everything you ask for. With the ability to download in various formats like JPG, JPEG, and PNG, sharing your slides has never been easier. From boardroom meetings to client pitches, this deck can be the secret weapon to leaving a lasting impression.
-
Statistical Methods For Modern Data Analysis PPT Structure AT
Ditch the Dull templates and opt for our engaging Statistical Methods For Modern Data Analysis PPT Structure AT deck to attract your audience. Our visually striking design effortlessly combines creativity with functionality, ensuring your content shines through. Compatible with Microsoft versions and Google Slides, it offers seamless integration of presentation. Save time and effort with our pre-designed PPT layout, while still having the freedom to customize fonts, colors, and everything you ask for. With the ability to download in various formats like JPG, JPEG, and PNG, sharing your slides has never been easier. From boardroom meetings to client pitches, this deck can be the secret weapon to leaving a lasting impression.
-
Statistical Approaches To Osteometric Data Interpretation Challenges PPT Demonstration AT
Ditch the Dull templates and opt for our engaging Statistical Approaches To Osteometric Data Interpretation Challenges PPT Demonstration AT deck to attract your audience. Our visually striking design effortlessly combines creativity with functionality, ensuring your content shines through. Compatible with Microsoft versions and Google Slides, it offers seamless integration of presentation. Save time and effort with our pre-designed PPT layout, while still having the freedom to customize fonts, colors, and everything you ask for. With the ability to download in various formats like JPG, JPEG, and PNG, sharing your slides has never been easier. From boardroom meetings to client pitches, this deck can be the secret weapon to leaving a lasting impression.
-
Understanding Data Patterns With Statistical Analysis PPT Sample AT
Step up your game with our enchanting Understanding Data Patterns With Statistical Analysis PPT Sample AT deck, guaranteed to leave a lasting impression on your audience. Crafted with a perfect balance of simplicity, and innovation, our deck empowers you to alter it to your specific needs. You can also change the color theme of the slide to mold it to your companys specific needs. Save time with our ready made design, compatible with Microsoft versions and Google Slides. Additionally, its available for download in various formats including JPG, JPEG, and PNG. Outshine your competitors with our fully editable and customized deck.
-
Statistical Tests Research For Data Analysis PPT Slides AT
While your presentation may contain top notch content, if it lacks visual appeal, you are not fully engaging your audience. Introducing our Statistical Tests Research For Data Analysis PPT Slides AT deck, designed to engage your audience. Our complete deck boasts a seamless blend of Creativity and versatility. You can effortlessly customize elements and color schemes to align with your brand identity. Save precious time with our pre designed template, compatible with Microsoft versions and Google Slides. Plus, its downloadable in multiple formats like JPG, JPEG, and PNG. Elevate your presentations and outshine your competitors effortlessly with our visually stunning 100 percent editable deck.
-
Statistical Tools For Population Data Comparison PPT Slides AT
While your presentation may contain top-notch content, if it lacks visual appeal, you are not fully engaging your audience. Introducing our Statistical Tools For Population Data Comparison PPT Slides AT deck, designed to engage your audience. Our complete deck boasts a seamless blend of Creativity and versatility. You can effortlessly customize elements and color schemes to align with your brand identity. Save precious time with our pre-designed template, compatible with Microsoft versions and Google Slides. Plus, its downloadable in multiple formats like JPG, JPEG, and PNG. Elevate your presentations and outshine your competitors effortlessly with our visually stunning 100 percent editable deck.
-
Statistical Analysis Techniques Healthcare Data Analytics Monitoring Dashboard
This slide represents the dashboard to monitor the data analytics in healthcare department. The key components of this slide are overall patient satisfaction, patients by division, average waiting time, total patients admitted, etc. Present the topic in a bit more detail with this Statistical Analysis Techniques Healthcare Data Analytics Monitoring Dashboard. Use it as a tool for discussion and navigation on Outpatient Vs Inpatients Trend, Overall Patient Satisfaction, Advisor Explained The Treatment Properly. This template is free to edit as deemed fit for your organization. Therefore download it now.
-
Ethical Considerations In Data Analysis R2 Statistical Measure Ppt Slides ST AI SS
Deliver an outstanding presentation on the topic using this Ethical Considerations In Data Analysis R2 Statistical Measure Ppt Slides ST AI SS. Dispense information and present a thorough explanation of Data Ethics, Statistical Integrity, R Squared Interpretation, Data Privacy using the slides given. This template can be altered and personalized to fit your needs. It is also available for immediate download. So grab it now.
-
Applications Of Statistical Analysis For Mastering Data Analytics A Comprehensive Data Analytics SS
This slide outlines real life applications of statistical analysis in various industries aimed compiling and reporting research findings. It covers use cases of finance, marketing, information technology, business management, etc. Introducing Applications Of Statistical Analysis For Mastering Data Analytics A Comprehensive Data Analytics SS to increase your presentation threshold. Encompassed with five stages, this template is a great option to educate and entice your audience. Dispence information on Production, Information Technology, Business Management, using this template. Grab it now to reap its full benefits.
-
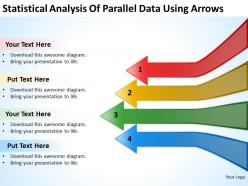
Powerpoint business statistical analysis of parallel data using arrows templates
We are proud to present our powerpoint business statistical analysis of parallel data using arrows templates. Visually support your Microsoft office PPT Presentation with our above template illustrating four steps to define and execute the plans. This diagram can be used to describe the business step-by-step workflows of components in a system. Deliver amazing presentations to mesmerize your audience.
-
Statistical analysis querying reports data marts information providers
Presenting this set of slides with name - Statistical Analysis Querying Reports Data Marts Information Providers. This is an editable five graphic that deals with topics like Statistical Analysis, Querying Reports, Data Marts, Information Providers to help convey your message better graphically. This product is a premium product available for immediate download, and is 100 percent editable in Powerpoint. Download this now and use it in your presentations to impress your audience.
-
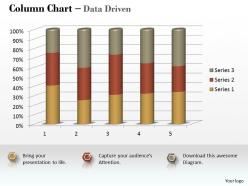
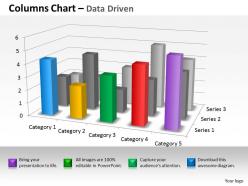
Data driven 3d statistical process column chart powerpoint slides
We are proud to present our data driven 3d statistical process column chart powerpoint slides. Use Our Data Driven 3D Statistical Process Column Chart Powerpoint Slides Power Point Templates Get Your Audience In Sync. Grab Their Eyeballs They Won?t Even Blink. You Work The Stage With An Air Of Royalty. Let Our Data Driven 3D Statistical Process Column Chart Powerpoint Slides Power Point Templates Be The Jewels In Your Crown.
-
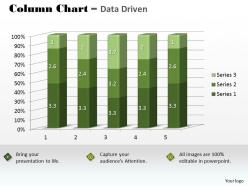
Data driven 3d statistical quality control chart powerpoint slides
We are proud to present our data driven 3d statistical quality control chart powerpoint slides. Put Your Wonderful Verbal Artistry On Display. Our Data Driven 3D Statistical Quality Control Chart Powerpoint Slides Power Point Templates Will Provide You The Necessary Glam And Glitter. You Have The Co-Ordinates For Your Destination Of Success. Let Our Data Driven 3D Statistical Quality Control Chart Powerpoint Slides Power Point Templates Map Out Your Journey.
-

Statistical Analysis Of Big Datas Four Vs
Introducing our captivating Infographic templates and one-pagers, designed to transform complex information into visually stunning stories. These user-friendly tools empower you to effortlessly communicate your ideas, data, and messages with clarity and impact. Our diverse collection offers a range of eye-catching designs, vibrant color schemes, and customizable elements, ensuring that every infographic or one-pager is tailored to your unique style and purpose. Whether you are presenting sales figures, explaining a process, or showcasing research findings, our templates provide the perfect canvas for your creativity. With intuitive editing features, even non-designers can effortlessly craft professional-grade visual content. You can simply tweak all the elements of the slide and enjoy the liberty of customizing all the components. Not only this, you can convert these slides in various formats including JPG, PNG, JPEG and PDF. Going well with Google Slides and major Microsoft versions, these templates can be presented on widescreen and standard screen seamlessly. the Grab attention, simplify complexity, and make a lasting impression with our Infographic templates and one-pagers, helping you turn information into unforgettable visual narrative. You can simply tweak all the elements of the slide and enjoy the liberty of customizing all the components. Not only this, you can convert these slides in various formats including JPG, PNG, JPEG and PDF. Going well with Google Slides and major Microsoft versions, these templates can be presented on widescreen and standard screen seamlessly.
-
Statistical Techniques For Analyzing Ordinal Data PPT Graphics AT
While your presentation may contain top-notch content, if it lacks visual appeal, you are not fully engaging your audience. Introducing our Statistical Techniques For Analyzing Ordinal Data PPT Graphics AT deck, designed to engage your audience. Our complete deck boasts a seamless blend of Creativity and versatility. You can effortlessly customize elements and color schemes to align with your brand identity. Save precious time with our pre-designed template, compatible with Microsoft versions and Google Slides. Plus, its downloadable in multiple formats like JPG, JPEG, and PNG. Elevate your presentations and outshine your competitors effortlessly with our visually stunning 100 percent editable deck.
-
From Data To Decision Using Statistical Significance Confidently PPT PowerPoint AT
Do not compromise on a template that erodes your messages impact. Introducing our engaging From Data To Decision Using Statistical Significance Confidently PPT PowerPoint AT complete deck, thoughtfully crafted to grab your audiences attention instantly. With this deck, effortlessly download and adjust elements, streamlining the customization process. Whether you are using Microsoft versions or Google Slides, it fits seamlessly into your workflow. Furthermore, it is accessible in JPG, JPEG, PNG, and PDF formats, facilitating easy sharing and editing. Not only that you also play with the color theme of your slides making it suitable as per your audiences preference.
-
Statistical Methods For Time Series Data Analysis PPT Information AT
Do not compromise on a template that erodes your messages impact. Introducing our engaging Statistical Methods For Time Series Data Analysis PPT Information AT complete deck, thoughtfully crafted to grab your audiences attention instantly. With this deck, effortlessly download and adjust elements, streamlining the customization process. Whether you are using Microsoft versions or Google Slides, it fits seamlessly into your workflow. Furthermore, it is accessible in JPG, JPEG, PNG, and PDF formats, facilitating easy sharing and editing. Not only that you also play with the color theme of your slides making it suitable as per your audiences preference.
-
Statistical Analysis Techniques For Descriptive Data Analysis PPT Demonstration AT
Ditch the Dull templates and opt for our engaging Statistical Analysis Techniques For Descriptive Data Analysis PPT Demonstration AT deck to attract your audience. Our visually striking design effortlessly combines creativity with functionality, ensuring your content shines through. Compatible with Microsoft versions and Google Slides, it offers seamless integration of presentation. Save time and effort with our pre designed PPT layout, while still having the freedom to customize fonts, colors, and everything you ask for. With the ability to download in various formats like JPG, JPEG, and PNG, sharing your slides has never been easier. From boardroom meetings to client pitches, this deck can be the secret weapon to leaving a lasting impression.
-
Advanced Statistical Techniques For Case Series Data Analysis PPT Summary AT
Step up your game with our enchanting Advanced Statistical Techniques For Case Series Data Analysis PPT Summary AT deck, guaranteed to leave a lasting impression on your audience. Crafted with a perfect balance of simplicity, and innovation, our deck empowers you to alter it to your specific needs. You can also change the color theme of the slide to mold it to your companys specific needs. Save time with our ready-made design, compatible with Microsoft versions and Google Slides. Additionally, its available for download in various formats including JPG, JPEG, and PNG. Outshine your competitors with our fully editable and customized deck.
-
Data Analytical Research Analysis Statistical Illustration
This colourful PowerPoint Illustration is perfect for illustrating data analytical research. It features a magnifying glass and a graph, representing the process of collecting and analyzing data. Its ideal for presentations, reports, and other documents.
-
Data driven 3d chart for statistical process powerpoint slides
Designed comes with professional approach as color and shape blend well. PowerPoint design can be viewed in standard and widescreen view. Easy to adjustable PPT slide as works well Google slides. Presentation template is easy to edit and amend elements like font, text, color etc. Top in picture and pixel quality. Harmonious with software options such as JPEG and PDF. PowerPoint graphic can be modified with corporate details as it comes with access to add business name
-
Data driven 3d interpretation of statistical quality control powerpoint slides
We are proud to present our data driven 3d interpretation of statistical quality control powerpoint slides. Our Data Driven 3D Interpretation Of Statistical Quality Control Powerpoint Slides Power Point Templates Are Creatively Constructed And Eye Catching. Focus Attention On The Key Issues Of Your Presentation. Use Our Data Driven 3D Interpretation Of Statistical Quality Control Powerpoint Slides Power Point Templates And Nail The Day. Lead Your Team Show Them The Way.
-
Data analytical culture icon depicting statistical analysis
Presenting our set of slides with Data Analytical Culture Icon Depicting Statistical Analysis. This exhibits information on three stages of the process. This is an easy to edit and innovatively designed PowerPoint template. So download immediately and highlight information on Data Analytical Culture Icon Depicting Statistical Analysis.
-
Statistical Models Applying Probability To Real World Data PPT Structure AT
Ditch the Dull templates and opt for our engaging Statistical Models Applying Probability To Real World Data PPT Structure AT deck to attract your audience. Our visually striking design effortlessly combines creativity with functionality, ensuring your content shines through. Compatible with Microsoft versions and Google Slides, it offers seamless integration of presentation. Save time and effort with our pre designed PPT layout, while still having the freedom to customize fonts, colors, and everything you ask for. With the ability to download in various formats like JPG, JPEG, and PNG, sharing your slides has never been easier. From boardroom meetings to client pitches, this deck can be the secret weapon to leaving a lasting impression.
-
Data scientist icon with expertise in statistical analysis
Presenting this set of slides with name Data Scientist Icon With Expertise In Statistical Analysis. The topics discussed in these slides is Data Scientist Icon With Expertise In Statistical Analysis. This is a completely editable PowerPoint presentation and is available for immediate download. Download now and impress your audience.
-
Statistical Techniques For Time Series And Cross Sectional Data PPT Demonstration AT
Step up your game with our enchanting Statistical Techniques For Time Series And Cross Sectional Data PPT Demonstration AT deck, guaranteed to leave a lasting impression on your audience. Crafted with a perfect balance of simplicity, and innovation, our deck empowers you to alter it to your specific needs. You can also change the color theme of the slide to mold it to your companys specific needs. Save time with our ready-made design, compatible with Microsoft versions and Google Slides. Additionally, its available for download in various formats including JPG, JPEG, and PNG. Outshine your competitors with our fully editable and customized deck.
-
Statistical Analysis Techniques Descriptive Statistics Based On The Shape Of Data
This slide demonstrates the kurtosis method of measuring data shape in descriptive statistical analysis. The purpose of this slide is to describe three possible kurtosis distributions, known as platykurtic, mesokurtic, and leptokurtic distributions. Present the topic in a bit more detail with this Statistical Analysis Techniques Descriptive Statistics Based On The Shape Of Data. Use it as a tool for discussion and navigation on Platykurtic, Mesokurtic, Leptokurtic. This template is free to edit as deemed fit for your organization. Therefore download it now.
-
Statistical Analysis Descriptive Statistics Based On The Shape Of Data Skewness
This slide demonstrates the skewness method of measuring the shape of data in descriptive statistical analysis. The purpose of this slide is to outline the unskewed, positively skewed, and negatively skewed distribution of data using a skewness curve. Introducing Statistical Analysis Descriptive Statistics Based On The Shape Of Data Skewness to increase your presentation threshold. Encompassed with Four stages, this template is a great option to educate and entice your audience. Dispence information on Positively Skewed, Negatively Skewed, using this template. Grab it now to reap its full benefits.
-

Yearly Rainfall Details And Statistical Analysis
Introducing our captivating Infographic templates and one-pagers, designed to transform complex information into visually stunning stories. These user-friendly tools empower you to effortlessly communicate your ideas, data, and messages with clarity and impact. Our diverse collection offers a range of eye-catching designs, vibrant color schemes, and customizable elements, ensuring that every infographic or one-pager is tailored to your unique style and purpose. Whether you are presenting sales figures, explaining a process, or showcasing research findings, our templates provide the perfect canvas for your creativity. With intuitive editing features, even non-designers can effortlessly craft professional-grade visual content. You can simply tweak all the elements of the slide and enjoy the liberty of customizing all the components. Not only this, you can convert these slides in various formats including JPG, PNG, JPEG and PDF. Going well with Google Slides and major Microsoft versions, these templates can be presented on widescreen and standard screen seamlessly. the Grab attention, simplify complexity, and make a lasting impression with our Infographic templates and one-pagers, helping you turn information into unforgettable visual narrative. You can simply tweak all the elements of the slide and enjoy the liberty of customizing all the components. Not only this, you can convert these slides in various formats including JPG, PNG, JPEG and PDF. Going well with Google Slides and major Microsoft versions, these templates can be presented on widescreen and standard screen seamlessly.
-
Statistical Concentric Circles For Detailed Analysis PPT Information AT
Do not compromise on a template that erodes your messages impact. Introducing our engaging Statistical Concentric Circles For Detailed Analysis PPT Information AT complete deck, thoughtfully crafted to grab your audiences attention instantly. With this deck, effortlessly download and adjust elements, streamlining the customization process. Whether you are using Microsoft versions or Google Slides, it fits seamlessly into your workflow. Furthermore, it is accessible in JPG, JPEG, PNG, and PDF formats, facilitating easy sharing and editing. Not only that you also play with the color theme of your slides making it suitable as per your audiences preference.
-
IoT Applications In Oil And Gas Statistical Graph Showcasing Reasons For Pipeline Damage IoT SS
The following slide provides a statistical graph showcasing the causes of pipeline damage incidents. It includes reasons such as excavation damage, incorrect operation, material failure of pipe, natural force damage, equipment failure, etc. Present the topic in a bit more detail with this IoT Applications In Oil And Gas Statistical Graph Showcasing Reasons For Pipeline Damage IoT SS. Use it as a tool for discussion and navigation on Fatal Accidents, Environmental Consequences, Property Damage, Statistical Graph. This template is free to edit as deemed fit for your organization. Therefore download it now.
-
Detailed Steps In Regression Analysis R2 Statistical Measure Ppt Template ST AI SS
Increase audience engagement and knowledge by dispensing information using Detailed Steps In Regression Analysis R2 Statistical Measure Ppt Template ST AI SS. This template helps you present information on six stages. You can also present information on Regression Analysis, R2 Statistic, Statistical Modeling, Predictive Analytics using this PPT design. This layout is completely editable so personaize it now to meet your audiences expectations.
-
Statistics Data Science Fundamentals PPT Template AT
Do not compromise on a template that erodes your messages impact. Introducing our engaging Statistics Data Science Fundamentals PPT Template AT complete deck, thoughtfully crafted to grab your audiences attention instantly. With this deck, effortlessly download and adjust elements, streamlining the customization process. Whether you are using Microsoft versions or Google Slides, it fits seamlessly into your workflow. Furthermore, it is accessible in JPG, JPEG, PNG, and PDF formats, facilitating easy sharing and editing. Not only that you also play with the color theme of your slides making it suitable as per your audiences preference.
-
Correlation Statistics Data Science In Powerpoint And Google Slides Cpb
Presenting Correlation Statistics Data Science In Powerpoint And Google Slides Cpb slide which is completely adaptable. The graphics in this PowerPoint slide showcase four stages that will help you succinctly convey the information. In addition, you can alternate the color, font size, font type, and shapes of this PPT layout according to your content. This PPT presentation can be accessed with Google Slides and is available in both standard screen and widescreen aspect ratios. It is also a useful set to elucidate topics like Correlation Statistics Data Science. This well-structured design can be downloaded in different formats like PDF, JPG, and PNG. So, without any delay, click on the download button now.
-
Key Statistics Data Analysis Monotone Icon In Powerpoint Pptx Png And Editable Eps Format
This Monotone PowerPoint icon is perfect for displaying key statistics in your presentation. It features a graph with an arrow pointing upwards, symbolizing an increase in data. Use this icon to highlight important information and draw attention to your key points.
-
0314 business ppt diagram timeline to display statistic data powerpoint template
Splendid picture quality. High quality visual ensures zero pixilation when projected on wide screen. Thoroughly editable slide design. Special guidance to execute the changes has been provided. Modify the PowerPoint icons, colors, shades and orientation as per the need of an hour. Highly compatible with multiple format options. Compatible with several online and offline software options. Used by marketers, business strategists, analysts, teachers and students. Personalization with company name and logo is a child’s play on the slide background.
-
Account based marketing statistics data storage marketing customer retention cpb
Presenting this set of slides with name - Account Based Marketing Statistics Data Storage Marketing Customer Retention Cpb. This is an editable six stages graphic that deals with topics like Account Based Marketing Statistics, Data Storage Marketing, Customer Retention to help convey your message better graphically. This product is a premium product available for immediate download, and is 100 percent editable in Powerpoint. Download this now and use it in your presentations to impress your audience.
-
Statistics data science ppt powerpoint presentation professional ideas cpb
Presenting our Statistics Data Science Ppt Powerpoint Presentation Professional Ideas Cpb PowerPoint template design. This PowerPoint slide showcases five stages. It is useful to share insightful information on Statistics Data Science This PPT slide can be easily accessed in standard screen and widescreen aspect ratios. It is also available in various formats like PDF, PNG, and JPG. Not only this, the PowerPoint slideshow is completely editable and you can effortlessly modify the font size, font type, and shapes according to your wish. Our PPT layout is compatible with Google Slides as well, so download and edit it as per your knowledge.
-
Statistics data transformation ppt powerpoint presentation summary icons cpb
Presenting our Statistics Data Transformation Ppt Powerpoint Presentation Summary Icons Cpb PowerPoint template design. This PowerPoint slide showcases four stages. It is useful to share insightful information on Statistics Data Transformation This PPT slide can be easily accessed in standard screen and widescreen aspect ratios. It is also available in various formats like PDF, PNG, and JPG. Not only this, the PowerPoint slideshow is completely editable and you can effortlessly modify the font size, font type, and shapes according to your wish. Our PPT layout is compatible with Google Slides as well, so download and edit it as per your knowledge.
-
Harnessing Data Statistics That Drive Equity In Education Initiatives PPT Template ACP
Do not compromise on a template that erodes your messages impact. Introducing our engaging Harnessing Data Statistics That Drive Equity In Education Initiatives PPT Template ACP complete deck, thoughtfully crafted to grab your audiences attention instantly. With this deck, effortlessly download and adjust elements, streamlining the customization process. Whether you are using Microsoft versions or Google Slides, it fits seamlessly into your workflow. Furthermore, it is accessible in JPG, JPEG, PNG, and PDF formats, facilitating easy sharing and editing. Not only that you also play with the color theme of your slides making it suitable as per your audiences preference.
-
Revenue Statistics Dashboard Data Driven Decisions PPT PowerPoint AT
Ditch the Dull templates and opt for our engaging Revenue Statistics Dashboard Data Driven Decisions PPT PowerPoint AT deck to attract your audience. Our visually striking design effortlessly combines creativity with functionality, ensuring your content shines through. Compatible with Microsoft versions and Google Slides, it offers seamless integration of presentation. Save time and effort with our pre-designed PPT layout, while still having the freedom to customize fonts, colors, and everything you ask for. With the ability to download in various formats like JPG, JPEG, and PNG, sharing your slides has never been easier. From boardroom meetings to client pitches, this deck can be the secret weapon to leaving a lasting impression.
-
Interpreting And Presenting Data Statistically PPT Demonstration AT
Step up your game with our enchanting Interpreting And Presenting Data Statistically PPT Demonstration AT deck, guaranteed to leave a lasting impression on your audience. Crafted with a perfect balance of simplicity, and innovation, our deck empowers you to alter it to your specific needs. You can also change the color theme of the slide to mold it to your companys specific needs. Save time with our ready-made design, compatible with Microsoft versions and Google Slides. Additionally, its available for download in various formats including JPG, JPEG, and PNG. Outshine your competitors with our fully editable and customized deck.
-
Introduction To Range Statistics In Data Analysis PPT Structure AT
Ditch the Dull templates and opt for our engaging Introduction To Range Statistics In Data Analysis PPT Structure AT deck to attract your audience. Our visually striking design effortlessly combines creativity with functionality, ensuring your content shines through. Compatible with Microsoft versions and Google Slides, it offers seamless integration of presentation. Save time and effort with our pre-designed PPT layout, while still having the freedom to customize fonts, colors, and everything you ask for. With the ability to download in various formats like JPG, JPEG, and PNG, sharing your slides has never been easier. From boardroom meetings to client pitches, this deck can be the secret weapon to leaving a lasting impression.









 Back
