

Powerpoint Templates for Statistical Data
Save time and engage your audience with our fully editable PowerPoint PPT Templates and Slides.
-

Data Management And Statistics PPT Designs VA
Dive into the world of data management with our dynamic data management and statistics PPT designs where visual storytelling meets professional presentation. Each slide is crafted with precision ensuring that your corporate presentation not only conveys information but also engages your audience. Featuring modern slide designs and editable layouts these templates are perfect for showcasing complex data with clarity. Youll find eyecatching infographics and data visualization tools that make your points resonate. Ideal for consultants and analysts alike this presentation deck will elevate your reports and pitch decks to new heights inviting collaboration and insight.
-

Inferential Statistics Making Predictions From Data PPT Slides AT
Do not compromise on a template that erodes your messages impact. Introducing our engaging Inferential Statistics Making Predictions From Data PPT Slides AT complete deck, thoughtfully crafted to grab your audiences attention instantly. With this deck, effortlessly download and adjust elements, streamlining the customization process. Whether you are using Microsoft versions or Google Slides, it fits seamlessly into your workflow. Furthermore, it is accessible in JPG, JPEG, PNG, and PDF formats, facilitating easy sharing and editing. Not only that you also play with the color theme of your slides making it suitable as per your audiences preference.
-
Visualizing Data With Descriptive Statistics And Graphs PPT Mockup AT
Do not compromise on a template that erodes your messages impact. Introducing our engaging Visualizing Data With Descriptive Statistics And Graphs PPT Mockup AT complete deck, thoughtfully crafted to grab your audiences attention instantly. With this deck, effortlessly download and adjust elements, streamlining the customization process. Whether you are using Microsoft versions or Google Slides, it fits seamlessly into your workflow. Furthermore, it is accessible in JPG, JPEG, PNG, and PDF formats, facilitating easy sharing and editing. Not only that you also play with the color theme of your slides making it suitable as per your audiences preference.
-
Understanding Data Through Summary Statistics Techniques PPT Summary AT
Ditch the Dull templates and opt for our engaging Understanding Data Through Summary Statistics Techniques PPT Summary AT deck to attract your audience. Our visually striking design effortlessly combines creativity with functionality, ensuring your content shines through. Compatible with Microsoft versions and Google Slides, it offers seamless integration of presentation. Save time and effort with our pre designed PPT layout, while still having the freedom to customize fonts, colors, and everything you ask for. With the ability to download in various formats like JPG, JPEG, and PNG, sharing your slides has never been easier. From boardroom meetings to client pitches, this deck can be the secret weapon to leaving a lasting impression.
-
Data Analysis And Statistics PPT Outline VA
Dive into the world of data analysis and statistics with our captivating PowerPoint presentation outline that promises to engage any audience. This meticulously crafted deck is perfect for conveying complex concepts through striking visuals and compelling storytelling. Packed with editable slides that allow for easy customization its designed for both business professionals and academic environments. Utilize these dynamic presentation graphics to highlight key data points making your findings not just informative but visually appealing. Whether youre pitching to stakeholders or teaching students this presentation bundle offers everything you need to simplify your insights and enhance understanding in an innovative way.
-
Visualize Data With Descriptive Statistics PPT Structure AT
Do not compromise on a template that erodes your messages impact. Introducing our engaging Visualize Data With Descriptive Statistics PPT Structure AT complete deck, thoughtfully crafted to grab your audiences attention instantly. With this deck, effortlessly download and adjust elements, streamlining the customization process. Whether you are using Microsoft versions or Google Slides, it fits seamlessly into your workflow. Furthermore, it is accessible in JPG, JPEG, PNG, and PDF formats, facilitating easy sharing and editing. Not only that you also play with the color theme of your slides making it suitable as per your audiences preference.
-
Analyzing Data Patterns Descriptive Statistics Masterclass PPT Template AT
Do not compromise on a template that erodes your messages impact. Introducing our engaging Analyzing Data Patterns Descriptive Statistics Masterclass PPT Template AT complete deck, thoughtfully crafted to grab your audiences attention instantly. With this deck, effortlessly download and adjust elements, streamlining the customization process. Whether you are using Microsoft versions or Google Slides, it fits seamlessly into your workflow. Furthermore, it is accessible in JPG, JPEG, PNG, and PDF formats, facilitating easy sharing and editing. Not only that you also play with the color theme of your slides making it suitable as per your audiences preference.
-
Statistics And Programming For Data Analysis PPT Presentation AT
Do not compromise on a template that erodes your messages impact. Introducing our engaging Statistics And Programming For Data Analysis PPT Presentation AT complete deck, thoughtfully crafted to grab your audiences attention instantly. With this deck, effortlessly download and adjust elements, streamlining the customization process. Whether you are using Microsoft versions or Google Slides, it fits seamlessly into your workflow. Furthermore, it is accessible in JPG, JPEG, PNG, and PDF formats, facilitating easy sharing and editing. Not only that you also play with the color theme of your slides making it suitable as per your audiences preference.
-
Visualizing Data With Descriptive Statistics PPT Presentation AT
Dive into the world of data insights with our Visualizing Data With Descriptive Statistics PowerPoint presentation. This expertly crafted deck offers a seamless blend of professional design and analytical depth, perfect for corporate settings or academic discussions. Each editable slide is tailored to enhance your visual storytelling, showcasing key statistical concepts through engaging graphics and data visualization techniques. Whether youre pitching to investors or presenting to colleagues, these infographic templates will elevate your message, making complex information accessible and compelling. Transform your presentations into impactful narratives that resonate with your audience, ensuring clarity and engagement throughout.
-
World Map With Data Visualization And Statistics PPT Guidelines AT
Step up your game with our enchanting World Map With Data Visualization And Statistics PPT Guidelines AT deck, guaranteed to leave a lasting impression on your audience. Crafted with a perfect balance of simplicity, and innovation, our deck empowers you to alter it to your specific needs. You can also change the color theme of the slide to mold it to your companys specific needs. Save time with our ready-made design, compatible with Microsoft versions and Google Slides. Additionally, its available for download in various formats including JPG, JPEG, and PNG. Outshine your competitors with our fully editable and customized deck.
-
Probability Theory For Data Analysis And Statistics PPT PowerPoint AT
Ditch the Dull templates and opt for our engaging Probability Theory For Data Analysis And Statistics PPT PowerPoint AT deck to attract your audience. Our visually striking design effortlessly combines creativity with functionality, ensuring your content shines through. Compatible with Microsoft versions and Google Slides, it offers seamless integration of presentation. Save time and effort with our pre-designed PPT layout, while still having the freedom to customize fonts, colors, and everything you ask for. With the ability to download in various formats like JPG, JPEG, and PNG, sharing your slides has never been easier. From boardroom meetings to client pitches, this deck can be the secret weapon to leaving a lasting impression.
-
Key Statistics Associated With Big Data Market In Healthcare Integrating Healthcare Technology DT SS V
This slide covers stats associated with big data in healthcare market. It involves details such as YoY growth, major regions, projected market value and key players and forcing factors of market. Deliver an outstanding presentation on the topic using this Key Statistics Associated With Big Data Market In Healthcare Integrating Healthcare Technology DT SS V. Dispense information and present a thorough explanation of Key Drivers, Growth, Big Data Market using the slides given. This template can be altered and personalized to fit your needs. It is also available for immediate download. So grab it now.
-
Statistics Showcasing Benefits Of Data Visualization
This slide showcases the statistics representing benefits of data visualization which helps an organization to provide deeper insights of conditions occurring within different information sets. It include details such as provides actionable items, etc. Introducing our Statistics Showcasing Benefits Of Data Visualization set of slides. The topics discussed in these slides are Data Visualization, Statistics Showcasing, Actionable ItemsThis is an immediately available PowerPoint presentation that can be conveniently customized. Download it and convince your audience.
-
Key Statistics Associated With Big Data Analytics Market Data Driven Insights Big Data Analytics SS V
This slide showcases various stats related to big data analytics which helps in identifying market growth prospects for future investments. It includes elements such as business profit, data generated, market share, investment etc. Present the topic in a bit more detail with this Key Statistics Associated With Big Data Analytics Market Data Driven Insights Big Data Analytics SS V Use it as a tool for discussion and navigation on Businesses, Data Analytics, Analytics Brings Profit This template is free to edit as deemed fit for your organization. Therefore download it now.
-
Statistics For Companies Using Data Analytics
This slide highlights statistical data for businesses employing data analytics. The purpose of this template is to provide organizations with required information for understanding broader landscape of the industry. It includes elements such as market share graph along with key insights. Presenting our well structured Statistics For Companies Using Data Analytics. The topics discussed in this slide are Using Data Analytics, Regions Covered, Prominent Players. This is an instantly available PowerPoint presentation that can be edited conveniently. Download it right away and captivate your audience.
-
Data Interpretation Key Statistics Monotone Icon In Powerpoint Pptx Png And Editable Eps Format
This Monotone PowerPoint icon is perfect for displaying key statistics in your presentation. It features a graph with an arrow pointing upwards, symbolizing an increase in data. Use this icon to highlight important information and draw attention to your key points.
-
Key Statistics Related To Customer Data Analytics
This slide presents key statistics related to customer data analytics that will induce managers to make informed decisions about marketing, sales, customer experience etc. Major statistics relate to retail, revenue, chatbot etc.Introducing our premium set of slides with Key Statistics Related To Customer Data Analytics. Ellicudate the six stages and present information using this PPT slide. This is a completely adaptable PowerPoint template design that can be used to interpret topics like customer data information, customers positive, neutral experience. So download instantly and tailor it with your information.
-
Data Accumulation Techniques Statistics In Powerpoint And Google Slides Cpb
Presenting our Data Accumulation Techniques Statistics In Powerpoint And Google Slides Cpb PowerPoint template design. This PowerPoint slide showcases three stages. It is useful to share insightful information on Data Accumulation Techniques Statistics This PPT slide can be easily accessed in standard screen and widescreen aspect ratios. It is also available in various formats like PDF, PNG, and JPG. Not only this, the PowerPoint slideshow is completely editable and you can effortlessly modify the font size, font type, and shapes according to your wish. Our PPT layout is compatible with Google Slides as well, so download and edit it as per your knowledge.
-
Primary data collection methods statistics ppt powerpoint portrait cpb
Presenting our Primary Data Collection Methods Statistics Ppt Powerpoint Portrait Cpb PowerPoint template design. This PowerPoint slide showcases three stages. It is useful to share insightful information on Primary Data Collection Methods Statistics This PPT slide can be easily accessed in standard screen and widescreen aspect ratios. It is also available in various formats like PDF, PNG, and JPG. Not only this, the PowerPoint slideshow is completely editable and you can effortlessly modify the font size, font type, and shapes according to your wish. Our PPT layout is compatible with Google Slides as well, so download and edit it as per your knowledge.
-
Financial data growth graph statistics decline graph ppt icons graphics
This PPT slide is a reliable way to present your company's financial matters and its practice related ideas. Engaging figures shown in this template can be resized and their colors can be changed according to your liking. Downloading this slide will give you access to its full version. You can be easily convert it into PDF or JPG formats.
-
Types of data in business statistics
Presenting our well structured Types Of Data In Business Statistics. The topics discussed in this slide are Qualitative Data, Equidistant, Measured. This is an instantly available PowerPoint presentation that can be edited conveniently. Download it right away and captivate your audience.
-
Data analysis using statistics ppt powerpoint presentation summary icon cpb
Presenting Data Analysis Using Statistics Ppt Powerpoint Presentation Summary Icon Cpb slide which is completely adaptable. The graphics in this PowerPoint slide showcase four stages that will help you succinctly convey the information. In addition, you can alternate the color, font size, font type, and shapes of this PPT layout according to your content. This PPT presentation can be accessed with Google Slides and is available in both standard screen and widescreen aspect ratios. It is also a useful set to elucidate topics like Data Analysis Using Statistics. This well-structured design can be downloaded in different formats like PDF, JPG, and PNG. So, without any delay, click on the download button now.
-

Data Facts And Statistics Of E Commerce Business
Introducing our captivating Infographic templates and one-pagers, designed to transform complex information into visually stunning stories. These user-friendly tools empower you to effortlessly communicate your ideas, data, and messages with clarity and impact. Our diverse collection offers a range of eye-catching designs, vibrant color schemes, and customizable elements, ensuring that every infographic or one-pager is tailored to your unique style and purpose. Whether you are presenting sales figures, explaining a process, or showcasing research findings, our templates provide the perfect canvas for your creativity. With intuitive editing features, even non-designers can effortlessly craft professional-grade visual content. You can simply tweak all the elements of the slide and enjoy the liberty of customizing all the components. Not only this, you can convert these slides in various formats including JPG, PNG, JPEG and PDF. Going well with Google Slides and major Microsoft versions, these templates can be presented on widescreen and standard screen seamlessly. the Grab attention, simplify complexity, and make a lasting impression with our Infographic templates and one-pagers, helping you turn information into unforgettable visual narrative. You can simply tweak all the elements of the slide and enjoy the liberty of customizing all the components. Not only this, you can convert these slides in various formats including JPG, PNG, JPEG and PDF. Going well with Google Slides and major Microsoft versions, these templates can be presented on widescreen and standard screen seamlessly.
-
Data Driven Digital Marketing Statistics Insights PPT Mockup AT
Do not compromise on a template that erodes your messages impact. Introducing our engaging Data Driven Digital Marketing Statistics Insights PPT Mockup AT complete deck, thoughtfully crafted to grab your audiences attention instantly. With this deck, effortlessly download and adjust elements, streamlining the customization process. Whether you are using Microsoft versions or Google Slides, it fits seamlessly into your workflow. Furthermore, it is accessible in JPG, JPEG, PNG, and PDF formats, facilitating easy sharing and editing. Not only that you also play with the color theme of your slides making it suitable as per your audiences preference.
-
Data Visualization And Descriptive Statistics PPT Example AT
Ditch the Dull templates and opt for our engaging Data Visualization And Descriptive Statistics PPT Example AT deck to attract your audience. Our visually striking design effortlessly combines creativity with functionality, ensuring your content shines through. Compatible with Microsoft versions and Google Slides, it offers seamless integration of presentation. Save time and effort with our pre-designed PPT layout, while still having the freedom to customize fonts, colors, and everything you ask for. With the ability to download in various formats like JPG, JPEG, and PNG, sharing your slides has never been easier. From boardroom meetings to client pitches, this deck can be the secret weapon to leaving a lasting impression.
-
Data Breach Trends And Statistics 2026 PPT Information AT
While your presentation may contain top-notch content, if it lacks visual appeal, you are not fully engaging your audience. Introducing our Data Breach Trends And Statistics 2026 PPT Information AT deck, designed to engage your audience. Our complete deck boasts a seamless blend of Creativity and versatility. You can effortlessly customize elements and color schemes to align with your brand identity. Save precious time with our pre-designed template, compatible with Microsoft versions and Google Slides. Plus, its downloadable in multiple formats like JPG, JPEG, and PNG. Elevate your presentations and outshine your competitors effortlessly with our visually stunning 100 percent editable deck.
-
How To Analyze Data Spread Using Descriptive Statistics PPT Summary AT
Step up your game with our enchanting How To Analyze Data Spread Using Descriptive Statistics PPT Summary AT deck, guaranteed to leave a lasting impression on your audience. Crafted with a perfect balance of simplicity, and innovation, our deck empowers you to alter it to your specific needs. You can also change the color theme of the slide to mold it to your companys specific needs. Save time with our ready made design, compatible with Microsoft versions and Google Slides. Additionally, its available for download in various formats including JPG, JPEG, and PNG. Outshine your competitors with our fully editable and customized deck.
-
Statistics Showcasing Detailed Employee Exit Data
This slide showcases report about employee leaving an organization with overall satisfaction. It includes aspects related to surveys completed, training and development, monthly exits, etc. Introducing our Statistics Showcasing Detailed Employee Exit Data set of slides. The topics discussed in these slides are Exiting Employees, Completed Surveys, Leaving For New JobThis is an immediately available PowerPoint presentation that can be conveniently customized. Download it and convince your audience.
-
Key Statistics Associated With Telecom Implementing Data Analytics To Enhance Telecom Data Analytics SS
This slide showcases various stats related to telecom analytics which helps in identifying growth prospects for investment. It includes elements such as customer churn rate, business revenue, data analytics, decision making, fraudulent practices, market growth etc. Deliver an outstanding presentation on the topic using this Key Statistics Associated With Telecom Implementing Data Analytics To Enhance Telecom Data Analytics SS. Dispense information and present a thorough explanation of Global Telecom Analytics Market, Decision Making, Business Revenue using the slides given. This template can be altered and personalized to fit your needs. It is also available for immediate download. So grab it now.
-
Introduction To Data Integration With Key Statistics Marketing Technology Stack Analysis
Following slide provides information about the concept of data integration in marketing. It includes key elements such as description, key statistics, advantages, and limitations. Deliver an outstanding presentation on the topic using this Introduction To Data Integration With Key Statistics Marketing Technology Stack Analysis Dispense information and present a thorough explanation of Organization Data, Efficiency, Increased Productivity using the slides given. This template can be altered and personalized to fit your needs. It is also available for immediate download. So grab it now.
-
Benefit Data Analysis Icon Showcasing Statistics
Introducing our premium set of slides with Benefit Data Analysis Icon Showcasing Statistics Ellicudate the three stages and present information using this PPT slide. This is a completely adaptable PowerPoint template design that can be used to interpret topics like Benefit Data Analysis, Showcasing Statistics So download instantly and tailor it with your information.
-
Data Sources For Publication Statistics PPT Example ST AI SS
Introducing Data Sources For Publication Statistics PPT Example ST AI SS to increase your presentation threshold. Encompassed with one stages, this template is a great option to educate and entice your audience. Dispence information on Publication Metrics,Research Analytics,Bibliometrics,Data Visualization using this template. Grab it now to reap its full benefits.
-
Data Driven Customer Segmentation Statistics With Action Plan
Following slide brings forth the major data driven statistics to be used by managers for effective segmentation and targeting the audience. The statistics are related to return on investment, click through rate, sales, customer purchase rate and brand message. Presenting our set of slides with name Data Driven Customer Segmentation Statistics With Action Plan. This exhibits information on five stages of the process. This is an easy to edit and innovatively designed PowerPoint template. So download immediately and highlight information on Return On Investment, Customer Purchase Rate, Brand Message.
-
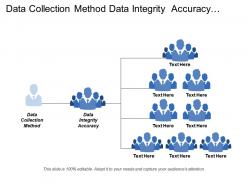
Data collection method data integrity accuracy basis statistics
Presenting this set of slides with name - Data Collection Method Data Integrity Accuracy Basis Statistics. This is an editable two graphic that deals with topics like data collection method, data integrity accuracy, basis statistics to help convey your message better graphically. This product is a premium product available for immediate download, and is 100 percent editable in Powerpoint. Download this now and use it in your presentations to impress your audience.
-
Data Usage Business Analytics Services Statistics Documenting
Introduce your topic and host expert discussion sessions with this Data Usage Business Analytics Services Statistics Documenting. This template is designed using high-quality visuals, images, graphics, etc, that can be used to showcase your expertise. Different topics can be tackled using the twelve slides included in this template. You can present each topic on a different slide to help your audience interpret the information more effectively. Apart from this, this PPT slideshow is available in two screen sizes, standard and widescreen making its delivery more impactful. This will not only help in presenting a birds-eye view of the topic but also keep your audience engaged. Since this PPT slideshow utilizes well-researched content, it induces strategic thinking and helps you convey your message in the best possible manner. The biggest feature of this design is that it comes with a host of editable features like color, font, background, etc. So, grab it now to deliver a unique presentation every time.
-
Big Data Driven Management Goals Achievement Statistics
This slide covers different stats on data driven culture business goals. It also includes percentage value of goals achieved from management and analysis of big data, statistics on competitive advantage, improve profitability, etc. Presenting our set of slides with Big Data Driven Management Goals Achievement Statistics. This exhibits information on six stages of the process. This is an easy to edit and innovatively designed PowerPoint template. So download immediately and highlight information on Improving Organizational, Efficiency And Profitability, Driving Increased Revenue.
-
Business Data Transformation Strategy Icon With Statistics
Introducing our Business Data Transformation Strategy Icon With Statistics set of slides. The topics discussed in these slides are Business, Data Transformation Strategy, Icon, Statistics. This is an immediately available PowerPoint presentation that can be conveniently customized. Download it and convince your audience.
-
Data report icon with various statistics
Presenting this set of slides with name Data Report Icon With Various Statistics. The topics discussed in these slides are Data Report, Introduction, Customers Experiences. This is a completely editable PowerPoint presentation and is available for immediate download. Download now and impress your audience.
-
Data team quarterly roadmap with statistics and machine learning
Presenting Data Team Quarterly Roadmap With Statistics And Machine Learning PowerPoint slide. This PPT presentation is Google Slides compatible hence it is easily accessible. This PPT theme is available in both 4,3 and 16,9 aspect ratios. This PowerPoint template is customizable so you can modify the font size, font type, color, and shapes as per your requirements. You can download and save this PowerPoint layout in different formats like PDF, PNG, and JPG.
-
Benchmark data competitive analysis market forces usage statistics
Presenting this set of slides with name - Benchmark Data Competitive Analysis Market Forces Usage Statistics. This is an editable seven stages graphic that deals with topics like Benchmark Data, Competitive Analysis, Market Forces, Usage Statistics to help convey your message better graphically. This product is a premium product available for immediate download, and is 100 percent editable in Powerpoint. Download this now and use it in your presentations to impress your audience.
-
Statistics ppt template with actual and target data
Presenting this set of slides with name Statistics PPT Template With Actual And Target Data. The topics discussed in these slides are Target, Actual, Sales. This is a completely editable PowerPoint presentation and is available for immediate download. Download now and impress your audience.
-
Data team half yearly roadmap with statistics and machine learning
Presenting Data Team Half Yearly Roadmap With Statistics And Machine Learning PowerPoint slide. This PPT theme is available in both 4,3 and 16,9 aspect ratios. This PowerPoint template is customizable so you can modify the font size, font type, color, and shapes as per your requirements. This PPT presentation is Google Slides compatible hence it is easily accessible. You can download and save this PowerPoint layout in different formats like PDF, PNG, and JPG.
-
Data team five years roadmap with statistics and machine learning
Presenting Data Team Five Years Roadmap With Statistics And Machine Learning PowerPoint slide which is 100 percent editable. You can change the color, font size, font type, and shapes of this PPT layout according to your needs. This PPT template is compatible with Google Slides and is available in both 4,3 and 16,9 aspect ratios. This ready to use PowerPoint presentation can be downloaded in various formats like PDF, JPG, and PNG.
-
Data team six months roadmap with statistics and machine learning
Presenting Data Team Six Months Roadmap With Statistics And Machine Learning PowerPoint Template. This PPT presentation is Google Slides compatible hence it is easily accessible. You can download and save this PowerPoint layout in different formats like PDF, PNG, and JPG. This PPT theme is available in both 4,3 and 16,9 aspect ratios. This PowerPoint template is customizable so you can modify the font size, font type, color, and shapes as per your requirements.
-
Data Types Analytics Business Programming Financial Government Statistics
Engage buyer personas and boost brand awareness by pitching yourself using this prefabricated set. This Data Types Analytics Business Programming Financial Government Statistics is a great tool to connect with your audience as it contains high-quality content and graphics. This helps in conveying your thoughts in a well-structured manner. It also helps you attain a competitive advantage because of its unique design and aesthetics. In addition to this, you can use this PPT design to portray information and educate your audience on various topics. With twelve slides, this is a great design to use for your upcoming presentations. Not only is it cost-effective but also easily pliable depending on your needs and requirements. As such color, font, or any other design component can be altered. It is also available for immediate download in different formats such as PNG, JPG, etc. So, without any further ado, download it now.
-
Key Statistics Associated With Business Analytics Complete Guide To Business Analytics Data Analytics SS
This slide showcases various teams involved in utilizing business analytics to improve business operations and optimize performance. It provides information regarding sales teams, human resource, finance and senior executives. Deliver an outstanding presentation on the topic using this Key Statistics Associated With Business Analytics Complete Guide To Business Analytics Data Analytics SS. Dispense information and present a thorough explanation of Key Statistics Associated, Business Analytics Market, Data Analytics Influences, Business Operations using the slides given. This template can be altered and personalized to fit your needs. It is also available for immediate download. So grab it now.
-
Statistics Outlining Importance Of Insurance Analytics Navigating The Future Of Insurance Data Analytics SS
This slide outlines statistical facts outlining importance of implementing data analytics in insurance to improve efficiency of claims, policy and sales processes. It covers facts related to optimized prediction, predictive analytics, investment in big data analytics and benefits. Increase audience engagement and knowledge by dispensing information using Statistics Outlining Importance Of Insurance Analytics Navigating The Future Of Insurance Data Analytics SS. This template helps you present information on four stages. You can also present information on Data Analytics Mechanisms, Current Investment Rate, Investment In Insurance Analytics using this PPT design. This layout is completely editable so personaize it now to meet your audiences expectations.
-
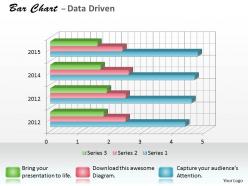
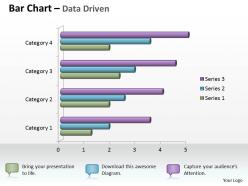
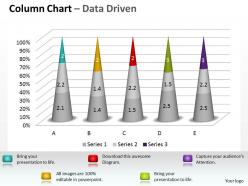
Data driven 3d bar chart for research in statistics powerpoint slides
Presenting data driven 3d bar chart for research in statistics presentation slides. Effortlessly alterable template slide as stats in excel sheet styles are customizable. This presentation slide is entirely flexible with Google Slides. Easy to download this template and save into JPEG and PDF format. Application of the best graphics, color, and icons. Quick to insert organization image, name, signature, copyright and picture for personalization of slide. Graphics quality does not get harm when displayed on widescreen. Instructional slides are available for guidance.
-
Data driven 3d bar chart for business statistics powerpoint slides
We are proud to present our data driven 3d bar chart for business statistics powerpoint slides. This Professionally designed PowerPoint template shows bar chart for business statistics. Using visual representations to present data and evaluation of activities makes audience easier to understand.
-
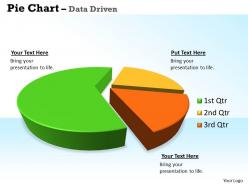
Data driven 3d pie chart for business statistics powerpoint slides
We are proud to present our data driven 3d pie chart for business statistics powerpoint slides. Put The Wind In Your Sails With Our Data Driven 3D Pie Chart For Business Statistics Powerpoint Slides Power Point Templates. Skim Smoothly Over The Choppy Waters Of The Market. Let Our Data Driven 3D Pie Chart For Business Statistics Powerpoint Slides Power Point Templates Give The Updraft To Your Ideas. See Them Soar To Great Heights With Ease.
-
Data driven 3d chart for interpretation of statistics powerpoint slides
We are proud to present our data driven 3d chart for interpretation of statistics powerpoint slides. A bar graph is composed of discrete bars that represent different categories of data. The length or height of the bar is equal to the quantity within that category of data. Bar graphs are best used to compare values across categories.
-
Single Vs Multiple Statistics Strategies In Detail PPT Graphics AT
Do not compromise on a template that erodes your messages impact. Introducing our engaging Single Vs Multiple Statistics Strategies In Detail PPT Graphics AT complete deck, thoughtfully crafted to grab your audiences attention instantly. With this deck, effortlessly download and adjust elements, streamlining the customization process. Whether you are using Microsoft versions or Google Slides, it fits seamlessly into your workflow. Furthermore, it is accessible in JPG, JPEG, PNG, and PDF formats, facilitating easy sharing and editing. Not only that you also play with the color theme of your slides making it suitable as per your audiences preference.
-
Detailed Banking Statistics Breakdown For 2026 PPT Structure AT
Step up your game with our enchanting Detailed Banking Statistics Breakdown For 2026 PPT Structure AT deck, guaranteed to leave a lasting impression on your audience. Crafted with a perfect balance of simplicity, and innovation, our deck empowers you to alter it to your specific needs. You can also change the color theme of the slide to mold it to your companys specific needs. Save time with our ready-made design, compatible with Microsoft versions and Google Slides. Additionally, its available for download in various formats including JPG, JPEG, and PNG. Outshine your competitors with our fully editable and customized deck.
-
Company Details With Its Key Statistics Strategies Sustainable Development
This slide shows the company details, founded year, headquarter, CEO, total employees, purpose etc. It also includes the company financials such as total profit and total revenue with key statistics. Introducing Company Details With Its Key Statistics Strategies Sustainable Development to increase your presentation threshold. Encompassed with ten stages, this template is a great option to educate and entice your audience. Dispence information on Business Overview, Statistics, Revenue, using this template. Grab it now to reap its full benefits.
-
Emerging Business Model Company Details With Its Key Statistics
This slide shows the company details, founded year, headquarter, CEO, total employees, purpose etc. It also includes the company financials such as total profit and total revenue with key statistics. Increase audience engagement and knowledge by dispensing information using Emerging Business Model Company Details With Its Key Statistics. This template helps you present information on ten stages. You can also present information on Business Overview, Total Employees, Total Profit, Total Revenue using this PPT design. This layout is completely editable so personaize it now to meet your audiences expectations.
-
Detailed overview of various offline marketing strategies future user statistics of the company
This slide shows the estimated future user statistics of the company after adopting Offline Marketing Strategies. These stats are related to sales revenue, churn rate, offline conversion rate, offline marketing ROI, customer satisfaction etc. from the years 2021 to 2023 along with key takeaways. Increase audience engagement and knowledge by dispensing information using Detailed Overview Of Various Offline Marketing Strategies Future User Statistics Of The Company. This template helps you present information on five stages. You can also present information on Marketing, Strategy, Statistics using this PPT design. This layout is completely editable so personaize it now to meet your audiences expectations.








 Back