

Target Vs Achieved Production KPI Metrices




Try Before you Buy Download Free Sample Product
 Impress Your
 Audience
 100%
100% Editable
 Save Hours
 of Time


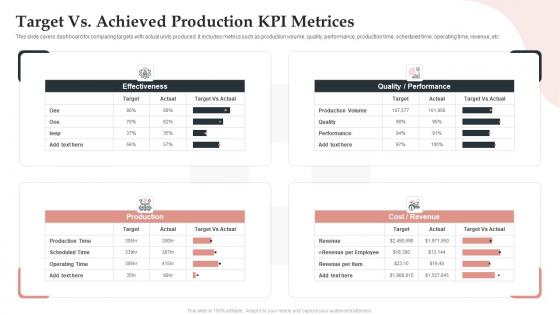
This slide covers dashboard for comparing targets with actual units produced. It includes metrics such as production volume, quality, performance, production time, scheduled time, operating time, revenue, etc.
People who downloaded this PowerPoint presentation also viewed the following :
Target Vs Achieved Production KPI Metrices with all 7 slides:
Use our Target Vs Achieved Production KPI Metrices to effectively help you save your valuable time. They are readymade to fit into any presentation structure.






FAQs for Target Vs Achieved
Critical production KPIs include overall equipment effectiveness (OEE), cycle time, defect rates, throughput, and inventory turnover, alongside safety metrics and cost per unit. These metrics streamline operational efficiency by identifying bottlenecks, minimizing waste, and optimizing resource allocation, with many manufacturing organizations finding that strategic KPI tracking delivers faster production cycles and enhanced competitive advantage.
Production KPI metrics can be tailored by focusing on industry-specific operational priorities, regulatory requirements, quality standards, and customer expectations unique to each sector. Manufacturing emphasizes throughput and defect rates, while healthcare prioritizes patient safety metrics and service delivery times, with financial services focusing on transaction accuracy and processing speed, ultimately enabling organizations to optimize performance against their most critical business outcomes.
Production KPI metrics serve as critical performance indicators that enable manufacturers to identify bottlenecks, optimize resource allocation, and streamline workflows across production lines. These metrics enhance operational efficiency by providing real-time visibility into equipment utilization, quality rates, and throughput performance, with many manufacturing organizations finding that data-driven insights ultimately deliver reduced costs and improved competitive positioning.
Businesses ensure production KPI data accuracy through automated data collection systems, real-time monitoring technologies, regular calibration of measurement equipment, standardized reporting protocols, and cross-verification processes. These approaches streamline data integrity by minimizing manual errors, enabling continuous validation, and establishing consistent measurement standards, with many manufacturers finding that integrated dashboard solutions ultimately deliver enhanced operational visibility and more reliable decision-making capabilities.
Best practices for setting realistic production KPI targets include analyzing historical performance data, benchmarking against industry standards, involving cross-functional teams in target development, and establishing incremental improvement goals rather than dramatic leaps. These approaches enable manufacturers to create achievable yet challenging targets by balancing operational capacity with strategic growth objectives, ultimately delivering sustained performance improvements and competitive advantage.
Visualization techniques enhance production KPI metrics understanding by transforming complex data into intuitive dashboards, real-time charts, and interactive displays that reveal patterns and trends immediately. Manufacturing facilities and production teams can quickly identify bottlenecks, track efficiency rates, and monitor quality indicators through visual formats, ultimately enabling faster decision-making and improved operational performance.
Organizations face challenges including data silos across departments, inconsistent measurement standards, resistance to performance transparency, and selecting relevant KPIs aligned with strategic goals. These obstacles often result in incomplete visibility, delayed decision-making, and missed optimization opportunities, with many manufacturers finding that overcoming these barriers through integrated dashboards and stakeholder buy-in ultimately delivers enhanced operational efficiency and competitive advantage.
Production KPI metrics drive continuous improvement by identifying performance gaps, benchmarking against industry standards, tracking progress over time, and highlighting inefficient processes requiring optimization. These metrics enable manufacturers to systematically reduce waste, enhance quality control, and streamline operations, with many organizations finding that data-driven insights ultimately deliver faster production cycles and significant cost reductions.
Companies align production KPIs with overall business objectives by establishing clear connections between manufacturing metrics and strategic goals, cascading targets from executive leadership to floor operations, and implementing integrated dashboards that track both operational and financial performance. This strategic alignment enables organizations to optimize resource allocation, enhance decision-making processes, and ultimately deliver improved profitability and competitive advantage.
**INPUT**: What technological tools and software can assist in tracking production KPI metrics? **OUTPUT**: Technological tools for tracking production KPIs include Manufacturing Execution Systems (MES), Enterprise Resource Planning (ERP) software, IoT sensors, real-time dashboards, and cloud-based analytics platforms. These technologies streamline data collection, automate reporting, and enhance visibility across operations, with manufacturing organizations finding that integrated systems deliver faster decision-making, reduced downtime, and improved operational efficiency. [Word count: 58 words]
Production KPIs should be reviewed monthly for operational metrics and quarterly for strategic indicators, with comprehensive annual assessments to ensure alignment with evolving business objectives. Manufacturing companies, automotive plants, and pharmaceutical facilities increasingly find that this tiered approach enables rapid response to production bottlenecks while maintaining long-term strategic focus, ultimately delivering improved operational efficiency and competitive advantage.
Employee engagement significantly impacts production KPIs by improving quality rates, reducing absenteeism, increasing productivity output, and minimizing safety incidents. Engaged employees deliver faster turnaround times, lower defect rates, and enhanced operational efficiency, with manufacturing facilities and production teams finding that higher engagement levels ultimately translate into measurable improvements in cost reduction and competitive advantage.
Production KPIs can be effectively communicated through standardized dashboards, regular cross-functional meetings, visual displays in work areas, automated reporting systems, and team-specific scorecards that translate metrics into relevant departmental contexts. This strategic approach enhances organizational alignment and operational efficiency, with many manufacturing organizations finding that consistent communication frameworks ultimately deliver improved collaboration and faster response times to production challenges.
Neglecting production KPI metrics can lead to inefficient resource allocation, missed quality issues, increased operational costs, and delayed response to performance bottlenecks. Without these critical measurements, manufacturers often experience reduced productivity, customer dissatisfaction from delivery delays, and competitive disadvantages, with many organizations finding that data-driven insights are essential for maintaining operational excellence and market position.
Companies can balance short-term production goals with long-term sustainability by implementing dual-horizon KPI frameworks that track immediate efficiency metrics alongside environmental and resource optimization indicators. This strategic approach enables manufacturers to monitor quarterly output targets while measuring waste reduction, energy consumption, and circular economy initiatives, with many organizations finding that sustainable practices ultimately deliver cost savings, operational resilience, and competitive advantage in increasingly eco-conscious markets.
-
Appreciate the research and its presentable format.
-
The templates are handy and I can personalize them as per my needs. Glad to be your subscriber!