


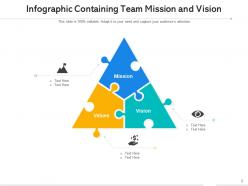
Team mission and vision puzzle infographic highlighting business objective




Try Before you Buy Download Free Sample Product
 Impress Your
 Audience
 100%
100% Editable
 Save Hours
 of Time


Our Team Mission And Vision Puzzle Infographic Highlighting Business Objective are topically designed to provide an attractive backdrop to any subject. Use them to look like a presentation pro.
People who downloaded this PowerPoint presentation also viewed the following :
Team mission and vision puzzle infographic highlighting business objective with all 12 slides:
Use our Team Mission And Vision Puzzle Infographic Highlighting Business Objective to effectively help you save your valuable time. They are readymade to fit into any presentation structure.
FAQs for Team mission and vision puzzle infographic
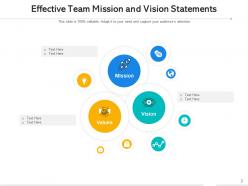
Effective team mission and vision infographics should include clear mission and vision statements, core values, strategic objectives, team roles, and success metrics. These elements work together by providing visual clarity, aligning team members around shared goals, and creating actionable frameworks, with many organizations finding that well-designed infographics enhance communication and drive consistent performance across departments.
Visual storytelling enhances mission and vision understanding by transforming abstract concepts into memorable narratives, incorporating relatable scenarios, compelling imagery, and clear visual hierarchies that resonate emotionally with team members. Through infographics, video presentations, and interactive dashboards, organizations streamline complex strategic messaging, improve retention rates, and foster deeper engagement, with many teams finding that visual narratives create stronger alignment and commitment to shared goals.
Blue and green schemes convey trust and growth, while orange and red communicate energy and passion for dynamic values. Purple suggests innovation and creativity, with neutral grays providing professional balance. Many organizations find that combining two complementary colors, such as blue with orange or green with purple, effectively reinforces their core values while maintaining visual clarity and professional appeal.
**INPUT**: How does the layout and design of an infographic impact team engagement with the mission and vision? **OUTPUT**: Well-designed infographics enhance team engagement by creating visual hierarchy, using compelling colors, incorporating memorable icons, and presenting information in digestible segments that resonate emotionally. Through strategic design elements, organizations streamline communication, improve message retention, and foster deeper connection with company values, with many teams finding that visually appealing mission statements increase participation and alignment across departments. **Word count: 58 words**
Common mistakes include overcrowding with excessive text, using generic corporate jargon instead of authentic language, creating visually cluttered designs, and failing to align content with actual team values. These pitfalls undermine engagement by making infographics difficult to read and remember, with many organizations finding that clear, concise messaging paired with clean visual hierarchy delivers significantly better team adoption and strategic alignment.
Infographics effectively communicate mission and vision evolution by visualizing transformation timelines, comparing before-and-after statements, highlighting key strategic shifts, and showcasing organizational growth milestones. These visual tools enable teams to track their journey, celebrate progress, and align stakeholders around updated objectives, with many organizations finding that timeline-based infographics enhance transparency and facilitate smoother transitions during strategic pivots.
Icons and symbols serve as visual shortcuts that instantly communicate complex concepts, eliminate language barriers, and create memorable associations with key mission elements. These visual elements streamline comprehension by replacing lengthy text blocks, enhance cross-cultural understanding in global organizations, and strengthen brand recognition, with many companies finding that well-chosen symbols significantly improve employee retention of core values and strategic objectives.
Teams should update their mission and vision infographics every 1-2 years, or when significant organizational changes occur, such as strategic pivots, market expansion, or leadership transitions. Regular updates ensure these visual tools remain aligned with evolving business objectives, with many organizations finding that refreshed infographics enhance employee engagement and maintain strategic clarity across departments.
Companies like Patagonia, Tesla, and Microsoft showcase effective mission-vision infographics through clear visual hierarchies, compelling iconography, and concise messaging that resonates across stakeholder groups. These organizations leverage strategic design elements, consistent brand colors, and accessible language to communicate their purpose, with many finding that well-crafted infographics enhance employee alignment and strengthen customer connections.
Teams can effectively gather comprehensive input through structured brainstorming sessions, anonymous digital surveys, cross-departmental workshops, and collaborative design platforms that enable real-time feedback. These approaches streamline diverse perspectives by encouraging open dialogue, capturing individual insights, and fostering collective ownership, with many organizations finding that inclusive development processes ultimately deliver stronger alignment, enhanced team buy-in, and more authentic mission statements.
**INPUT**: What tools or software are recommended for creating high-quality infographics? **OUTPUT**: Recommended infographic creation tools include Canva, Adobe Illustrator, Piktochart, Venngage, and Infogram, each offering templates, design elements, and data visualization capabilities. These platforms streamline the design process by providing drag-and-drop functionality, professional templates, and brand customization options, with many organizations finding that user-friendly tools like Canva deliver professional results while minimizing design expertise requirements. [Word count: 58 words]
Infographics help align team members by transforming complex organizational goals into clear, memorable visual narratives that enhance understanding, retention, and engagement across different learning styles. Through strategic design elements, departments can visualize their specific contributions to broader objectives, track progress transparently, and maintain consistent messaging, with many organizations finding that visual goal-setting increases team cohesion and accountability significantly.
Effective strategies include hierarchical organization, visual chunking, progressive disclosure, consistent iconography, and strategic color coding to guide reader flow. These approaches streamline complex data by breaking information into digestible segments, using visual metaphors for abstract concepts, and maintaining clear information pathways, with many organizations finding that well-structured infographics enhance stakeholder understanding and team alignment significantly.
Infographics support team onboarding by visually presenting mission statements, organizational structures, key processes, role expectations, and company values in easily digestible formats. These visual tools streamline information absorption, reduce cognitive overload during orientation sessions, and enable faster cultural integration, with many organizations finding that new hires retain essential information more effectively and feel more connected to team objectives from day one.
Social media platforms enable teams to amplify their mission and vision infographics through strategic posting across LinkedIn, Twitter, Instagram, Facebook, and company blogs, utilizing hashtags, employee advocacy, and targeted campaigns. These platforms streamline message distribution by reaching diverse audiences, encouraging engagement through shares and comments, and building brand awareness, with many organizations finding that visual content generates significantly higher interaction rates and reinforces organizational culture.
-
Informative presentations that are easily editable.
-
Easy to edit slides with easy to understand instructions.
-
Content of slide is easy to understand and edit.