


Three option diagram with technology icons flat powerpoint design






Try Before you Buy Download Free Sample Product
 Impress Your
Audience
 100%
Editable
 Save Hours
of Time


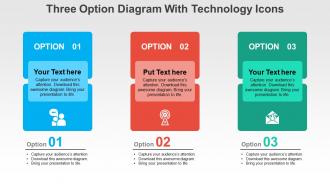
If you are looking for novel and colorful means of making your presentation more attractive and equally informative, then download our three options diagram with technology icons flat PowerPoint design. In this available options PPT PowerPoint presentation example, the three options PPT presentation diagram for PowerPoint represent any information or data that can be grouped under three options. For example, you can use this PowerPoint PPT slide design template as an alternative to numbered or black and white listed bullet points. Instead of showing 1, 2 and 3, you can use the three options PowerPoint icons to decipher your knowledge. The other plus point of the presentation example is the use of PPT icons which ease the level of understanding associated with the PPT presentation. The pictorial modes of representations of facts and figures are a great way to educate and equally impress the audience with your talent and efforts. Add on the gloss with our Three Option Diagram With Technology Icons Flat Powerpoint Design. You will come up with brighter thoughts.
People who downloaded this PowerPoint presentation also viewed the following :
Three option diagram with technology icons flat powerpoint design with all 4 slides:
Be the first to get across barriers with our Three Option Diagram With Technology Icons Flat Powerpoint Design. They help dismantle any that you encounter.
FAQs for Three option diagram with technology icons
Three options work because people don't feel like you're pushing them into something. They actually get to weigh choices instead of being sold to. Two feels pushy - like you're boxing them in, you know? But five gets overwhelming. Three hits that sweet spot psychologically. Also shows you did your homework by exploring alternatives. Here's a trick for your next one - position your recommendation as the middle ground between two extremes. Works way better than I expected it would. People love feeling like they chose the reasonable option themselves.
Dude, three option diagrams are honestly a game changer when you're drowning in choices. Your brain just handles three things way better than like... fifteen random possibilities. I've started using them for work stuff - project decisions, budget allocations, whatever. Makes the whole thing visual so you can actually see what you're trading off. Plus later when your boss asks "why'd you pick that?" you don't sound like you're making stuff up on the spot. Seriously though, try it next time you're stuck on something big. Way less overwhelming than those endless pro/con lists.
Use three-option diagrams when you're showing strategic choices to stakeholders. Perfect for comparing vendors, different project approaches, or alternative solutions. Three is honestly the sweet spot - won't overwhelm people like five options would, but gives way more flexibility than just yes/no. Executives love these because they can quickly see the trade-offs without getting bogged down. Really effective when you want to guide decisions without looking like you're pushing one specific agenda. I always go back to this format when presenting big choices.
Balance is key for your three-option thing. Same size boxes, consistent spacing - you know the drill. Keep text amounts similar across all options too. I'd go neutral on colors or do that good/better/best gradient thing. People always screw this up by making one option super obvious (which honestly defeats the purpose). Format descriptions the same way and keep text tight. Icons are nice if they match in style. Short sentences work. But also mix in some longer ones that actually flow naturally when you read them. Test it on someone else first - they'll spot if one choice feels way more appealing.
Color psychology really works for those three-option diagrams! Green feels like "go ahead" while red screams warning - honestly, I made the mistake of using red for my preferred choice once and nobody picked it lol. Blue's your friend for trustworthy options. Make your top recommendation the most vibrant color and use duller tones for the meh choices. Oh, and don't forget contrast ratios so people can actually read the thing - learned that one from my colorblind colleague who couldn't see half my charts.
Honestly, I'd go with Lucidchart, Miro, or just PowerPoint depending on what you're doing. PowerPoint gets overlooked but their SmartArt is actually pretty solid these days - plus you probably already have it. Lucidchart's where it's at for complex stuff or when you need multiple people working on it at once. Their templates are really clean too. Miro's more for the visual brainstorming type diagrams, kinda artsy if that makes sense? I'd say start with PowerPoint if you've got Office, otherwise try Lucidchart's free version first.
Make sure each option stands out clearly - use lots of white space, different colors, or thick borders between them. Your text needs to be big enough that people don't have to squint. Keep the language simple and direct. I always do one main point per option instead of stuffing too much info in there. For layout, go left to right if there's a preferred order, or try a triangle setup if they're all equal choices. Honestly, the best test is showing it to someone else first - if they can't instantly tell what the three options are, you need to tweak it.
Don't make your three options basically the same thing with tiny tweaks - you need real differences between them. I hate when people present one obvious choice next to two garbage options because they've already decided but want to seem collaborative (so annoying). Your options can't be super vague either. Get specific about what each path actually means in practice. Each choice should have clear upsides and downsides - that's what makes people think through the trade-offs properly. The whole point is helping folks weigh real alternatives, not just rubber-stamp your preferred solution.
Just drop some charts or graphs right into each option branch - bar charts for costs, timeline stuff, maybe icons with percentages. Whatever makes the comparison obvious. I'd focus on the main differences between your three choices first, then figure out the simplest way to show that visually. Don't go crazy with it though. I've definitely seen people cram way too much data in there and it just becomes a mess. Short sentences work better than cramming everything together. The whole point is helping people decide, not making them squint at tiny numbers everywhere.
Okay so basically you need to turn that boring decision tree into actual stories people can follow. Like "we're here, and if we pick option A, here's what happens next..." Trust me, nobody cares about feature lists - they're painfully dull. Walk them through real scenarios instead. What does each path actually look like? Each option needs its own little story with clear outcomes so people can picture themselves going through it. I always start with something like "Picture this..." and suddenly everyone's actually paying attention. Makes such a huge difference when they can visualize the whole thing.
Three options max - trust me on this. Your brainstorming sessions will actually get somewhere instead of spiraling into chaos with 20 random ideas nobody remembers. Decision paralysis becomes way less of a thing when you're only comparing three solid choices. You can see pros/cons clearly, figure out what resources you'll need, check timelines. Oh and it shuts down that one teammate who always pitches the most unrealistic stuff (we all have one). Set a 15-minute timer to nail down your options, then dig into the details.
Dude, three-option setups are literally everywhere once you start noticing. SaaS companies do it with basic/premium/enterprise tiers. Consulting firms present stuff like "stay the same/small changes/blow it all up." Project managers use them for different approaches too. Three options just hits different - not too many choices but still feels like actual variety. Marketing uses this for pricing all the time. HR does it with benefits packages or career tracks. Oh and I've noticed my brain defaults to three when I'm overthinking restaurant menus too lol. Next presentation you do, try three clear options with obvious trade-offs. Works every time.
Try making each option clickable so people can dive deeper into whatever interests them. Hover effects work great too - stuff lights up when you mouse over it. PowerPoint and Figma handle this pretty well, though honestly PowerPoint can be finicky sometimes. Branching paths are cool where clicking takes you down different slides. Animations help - like the chosen option expands while others fade away. For web stuff, H5P is solid or basic JavaScript if you're feeling ambitious. Start with simple click-to-reveal and see how your audience responds. You can always get fancier later.
So there's basically three types - the simple three-box one (perfect for quick yes/no stuff), then there's a weighted version where you actually score everything with numbers, and a time-based one that tracks how things might change. Honestly? I'm obsessed with the weighted approach because it makes you stop being wishy-washy about what actually matters. Use the basic one when you're brainstorming with your team. Go weighted for complicated decisions with tons of moving parts. The time-based version works great when you're dealing with different timelines or when risks shift over time. Just pick whatever doesn't make your brain hurt.
Honestly, you've gotta test that diagram with real people first. I learned this the hard way - made this "brilliant" three-option thing that nobody understood except me. Watch where they pause or look confused. What questions do they ask? Which option do they pick? Their reactions will show you if your labels suck or if the choices don't make sense. Then tweak it based on what you learn. Seriously, run it by like 3-4 people before your actual presentation. Trust me on this one.
-
Professional and unique presentations.
-
Great product with effective design. Helped a lot in our corporate presentations. Easy to edit and stunning visuals.