


Tracking ad campaign performance dashboard ctr powerpoint presentation tips




Try Before you Buy Download Free Sample Product
 Impress Your
 Audience
 100%
100% Editable
 Save Hours
 of Time


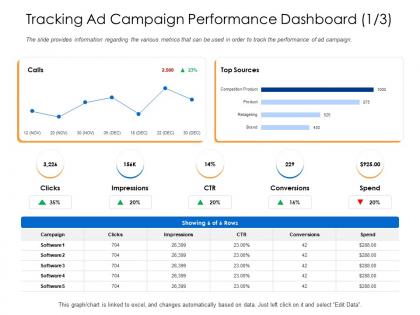
The slide provides information regarding the various metrics that can be used in order to track the performance of ad campaign.
People who downloaded this PowerPoint presentation also viewed the following :
Tracking ad campaign performance dashboard ctr powerpoint presentation tips with all 2 slides:
Use our Tracking Ad Campaign Performance Dashboard Ctr Powerpoint Presentation Tips to effectively help you save your valuable time. They are readymade to fit into any presentation structure.
FAQs for Tracking ad campaign performance dashboard ctr
Essential KPIs for ad campaign performance dashboards include click-through rates, conversion rates, cost per acquisition, return on ad spend, and impression reach metrics. These indicators enable marketing teams to optimize budget allocation, identify high-performing channels, and demonstrate ROI across platforms, with many organizations finding that comprehensive tracking ultimately delivers better campaign targeting and significantly improved marketing efficiency.
Visualizations enhance ad campaign performance understanding by transforming complex metrics into intuitive charts, graphs, and heat maps that reveal trends, patterns, and anomalies at a glance. Through interactive dashboards, marketing teams can quickly identify top-performing segments, optimize budget allocation, and spot underperforming campaigns, ultimately enabling faster decision-making and improved ROI across channels.
**INPUT**: What tools are most effective for creating and managing an ad campaign performance dashboard? **OUTPUT**: Effective dashboard tools include Google Analytics, Tableau, Power BI, Google Data Studio, and HubSpot, each offering real-time tracking and comprehensive reporting capabilities. These platforms streamline campaign analysis by integrating multiple data sources, automating performance metrics, and delivering actionable insights, with many marketing teams finding that centralized dashboards ultimately enhance ROI optimization and strategic decision-making.
Real-time or hourly updates work best for active campaigns requiring quick optimization, while daily updates suffice for strategic analysis and reporting. The frequency depends on campaign budget, duration, and objectives, with high-spend campaigns benefiting from real-time monitoring to enable immediate adjustments, while brand awareness campaigns can utilize daily updates for strategic insights.
Best practices for segmenting data in ad campaign performance dashboards include demographic breakdowns, geographic targeting, device types, time-based analysis, and audience behavior patterns. These segmentation approaches enhance campaign optimization by identifying high-performing audience segments, revealing geographic opportunities, and enabling precise budget allocation, with many marketing teams finding that granular segmentation delivers significantly improved ROI and targeted messaging effectiveness.
A/B testing results integrate into performance dashboards through automated data connections, real-time variant comparison widgets, statistical significance indicators, and conversion funnel breakdowns by test groups. This integration enables marketers to instantly compare campaign versions, identify winning elements, and optimize budget allocation across channels, with many organizations finding that consolidated A/B insights accelerate decision-making and improve ROI by 25-40%.
Audience targeting data enables marketers to evaluate campaign effectiveness by revealing which demographics, interests, behaviors, and geographic segments respond most favorably to specific messaging and creative elements. This granular insight helps organizations optimize budget allocation, refine targeting parameters, and personalize future campaigns, with many retail and financial services companies finding that precise audience analysis significantly improves conversion rates and reduces acquisition costs.
Attribution modeling can be represented through multi-touch journey visualizations, conversion path flowcharts, channel contribution breakdowns, weighted touchpoint analysis, and time-decay attribution charts. These dashboard elements enable marketers to understand customer interactions across touchpoints, optimize budget allocation between channels, and demonstrate true campaign impact, with many organizations finding that visual attribution data significantly enhances strategic decision-making and ROI measurement.
Essential ROAS metrics include conversion rate, cost per acquisition, customer lifetime value, attribution modeling, and revenue per click. These metrics streamline campaign optimization by identifying high-performing channels, minimizing wasted spend, and maximizing profitable customer acquisition, with many marketers finding that integrated tracking delivers significantly improved budget allocation and campaign ROI.
User engagement metrics can be effectively displayed through interactive visualizations, real-time conversion funnels, heat maps, comparative performance charts, and segmented audience analytics. These dashboard elements streamline campaign optimization by highlighting click-through rates, time-on-page patterns, and conversion pathways, with many marketing teams finding that visual data integration ultimately delivers faster decision-making and improved ROI.
Data aggregation challenges include inconsistent metrics definitions across platforms, API limitations and rate restrictions, varying data refresh frequencies, attribution model conflicts, and currency or timezone discrepancies. These technical hurdles can result in incomplete reporting, delayed insights, and misaligned performance indicators, with many marketing teams finding that establishing standardized data mapping and automated synchronization processes ultimately delivers more accurate cross-platform visibility.
Predictive analytics enhances ad campaign decision-making by forecasting audience behavior, optimizing budget allocation, and identifying high-performing creative elements before campaigns fully deploy. Through machine learning algorithms, marketers can anticipate conversion rates, predict seasonal trends, and automatically adjust targeting parameters, with many digital marketing teams finding that predictive insights reduce acquisition costs while increasing campaign ROI significantly.
Comparing historical data against current campaign performance enables marketers to identify trends, measure improvement rates, and optimize resource allocation based on proven patterns. This strategic analysis helps organizations benchmark success metrics, predict seasonal fluctuations, and adjust targeting strategies, with many marketing teams finding that historical comparisons ultimately deliver more precise budget decisions and sustained competitive advantage.
Dashboard insights translate into actionable strategies by revealing audience segments with highest conversion rates, identifying optimal timing and channels, and highlighting messaging that drives engagement. Through performance analytics, marketers can reallocate budgets toward high-performing demographics, refine creative elements, and eliminate underperforming placements, ultimately delivering improved ROI and more targeted future campaigns.
Focusing excessively on vanity metrics like impressions, clicks, and social media followers can mislead campaign strategy by emphasizing visibility over actual business impact and revenue generation. These surface-level indicators often mask poor conversion rates, low customer lifetime value, and weak ROI, with many marketing teams finding that prioritizing engagement metrics over qualified leads and sales ultimately undermines strategic decision-making and budget allocation effectiveness.
-
Amazing product with appealing content and design.
-
Excellent products for quick understanding.
-
Very unique and reliable designs.