


Trade Marketing KPI With Cost Per Click




Try Before you Buy Download Free Sample Product
 Impress Your
 Audience
 100%
100% Editable
 Save Hours
 of Time


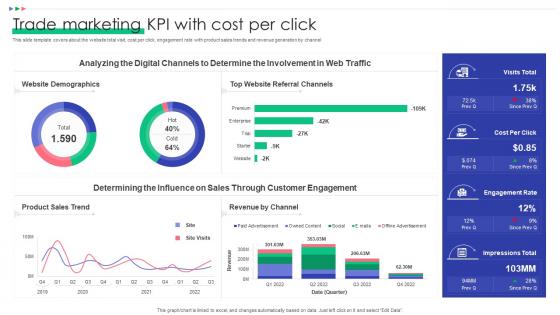
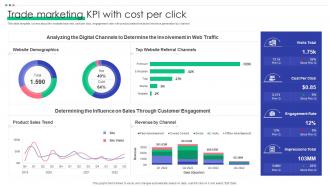
This slide template covers about the website total visit, cost per click, engagement rate with product sales trends and revenue generation by channel.
People who downloaded this PowerPoint presentation also viewed the following :
Trade Marketing KPI With Cost Per Click with all 7 slides:
Use our Trade Marketing KPI With Cost Per Click to effectively help you save your valuable time. They are readymade to fit into any presentation structure.





FAQs for Trade Marketing KPI With
Critical trade marketing KPIs include sell-through rates, inventory turnover, market share growth, promotional lift effectiveness, and retailer compliance scores. These metrics enable brands to optimize channel performance, strengthen retailer partnerships, and drive revenue growth, with companies in consumer goods and retail finding that tracking these KPIs delivers improved shelf visibility and competitive positioning.
Trade marketing KPIs align with business objectives through strategic metric selection, cross-functional collaboration, and regular performance reviews that connect channel activities to revenue goals. By establishing clear linkages between trade spend, market share growth, and profitability targets, organizations streamline resource allocation and enhance ROI measurement, ultimately delivering improved partner relationships and accelerated market penetration across retail channels.
Customer engagement metrics serve as critical indicators of trade marketing effectiveness by measuring interaction quality, response rates, promotional participation levels, and brand loyalty across retail partners and end consumers. These metrics enable companies to assess campaign resonance, optimize resource allocation, and strengthen retailer relationships, with many organizations finding that higher engagement scores directly correlate with increased sales velocity and market share growth.
Sales data enables trade marketing KPI benchmarking by analyzing historical performance trends, seasonal variations, regional differences, and product-specific metrics to establish realistic targets. Through comprehensive data analysis, organizations can identify top-performing territories, optimal promotional periods, and effective trade spend allocations, ultimately delivering more accurate forecasting and strategic resource optimization across diverse market conditions.
Trade marketing performance data can be collected through POS systems, retailer analytics platforms, syndicated market research, trade spend tracking software, and field sales reporting tools. These methods enable manufacturers to monitor promotional effectiveness, inventory turnover, and market share across different retail channels, with many consumer goods companies finding that integrated data approaches deliver more accurate insights and faster strategic adjustments.
Trade promotion effectiveness can be measured through KPIs including incremental sales lift, return on investment (ROI), market share growth, inventory turnover rates, and promotional compliance metrics. These measurements enable retailers and manufacturers to assess campaign performance by tracking revenue increases, cost efficiency, and customer engagement levels, while many consumer goods companies find that combining volume-based and profitability metrics delivers optimal promotional optimization.
Inventory turnover rates should directly influence trade marketing strategies by determining promotional timing, channel partner incentives, and demand generation tactics. Higher turnover rates enable more aggressive market expansion and frequent campaign cycles, while slower turnover requires strategic inventory management programs and targeted retailer support, ultimately helping organizations optimize cash flow, reduce carrying costs, and strengthen distributor relationships.
Assessing trade marketing ROI involves tracking conversion rates, incremental sales volume, market share growth, customer acquisition costs, and promotional lift metrics. These KPIs enable businesses to measure campaign effectiveness by comparing pre and post-campaign performance, calculating cost-per-acquisition ratios, and analyzing sell-through rates, with many retail organizations finding that comprehensive measurement frameworks ultimately deliver strategic insights and optimize future promotional investments.
Consumer behavior analysis enhances trade marketing KPIs by providing deeper insights into purchase patterns, brand preferences, seasonal trends, and price sensitivity across different retail channels. Through advanced analytics and customer segmentation, retailers and manufacturers can optimize inventory management, improve promotional effectiveness, and strengthen channel partnerships, ultimately delivering higher sales velocity, better market penetration, and enhanced trade relationship profitability.
Key KPIs for in-store promotions include sales lift percentage, incremental volume, promotional ROI, basket size increase, and customer conversion rates. These metrics work together by tracking immediate revenue impact, long-term customer behavior changes, and cost efficiency, with many retailers finding that combining sales velocity data with customer acquisition metrics delivers the most comprehensive promotional performance insights.
Digital marketing metrics integrate with traditional trade marketing KPIs through unified dashboard analytics, cross-channel attribution modeling, and real-time data synchronization across platforms. This strategic combination enables retailers and manufacturers to track customer journey progression from digital touchpoints to in-store conversions, while measuring promotional effectiveness, inventory velocity, and brand visibility simultaneously, ultimately delivering comprehensive performance insights and enhanced ROI optimization.
Challenges in setting realistic trade marketing KPI targets include limited historical data, unpredictable market conditions, complex distributor relationships, varying regional performance, and conflicting stakeholder expectations. Many organizations find that balancing ambitious growth objectives with achievable benchmarks requires continuous market analysis, flexible goal-setting frameworks, and regular target adjustments, ultimately delivering more accurate forecasting and sustainable performance improvements.
B2B trade marketing KPIs focus on channel partner performance, distributor sell-through rates, partner relationship strength, and long-term contract value, while B2C emphasizes consumer engagement metrics, brand awareness, retail velocity, and promotional effectiveness. B2B organizations typically measure partner enablement success and channel profitability, whereas B2C companies prioritize market share growth and consumer conversion rates, ultimately delivering different strategic advantages for each business model.
Trade marketing KPI tracking tools include Salesforce Analytics, Microsoft Power BI, Tableau, Nielsen Connect, and IRI Consumer Connect platforms. These solutions streamline performance monitoring by automating data collection, providing real-time dashboards, and enabling comprehensive reporting across retail channels, with many organizations finding that integrated analytics platforms deliver enhanced visibility and faster decision-making capabilities.
Trade marketing teams can foster collaboration with sales teams through regular joint planning sessions, shared KPI dashboards, integrated communication platforms, and cross-functional performance incentives. By aligning on common objectives like market penetration and revenue growth, establishing weekly sync meetings, and creating shared accountability for metrics such as sell-through rates and promotional ROI, organizations ultimately deliver improved market execution and enhanced competitive advantage.
-
Very unique, user-friendly presentation interface.
-
Templates are beautiful and easy to use. An amateur can also create a presentation using these slides. It is amazing.