


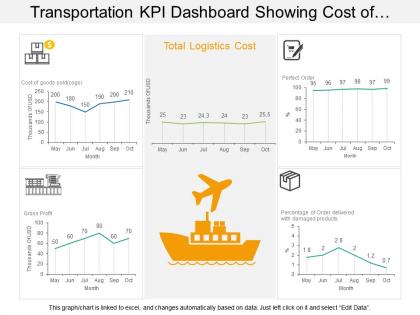
Transportation kpi dashboard showing cost of good sold logistics cost and gross profit




Try Before you Buy Download Free Sample Product
 Impress Your
 Audience
 100%
100% Editable
 Save Hours
 of Time


Download transportation KPI dashboard showing cost of goods sold logistics cost and gross profit PPT slide to handle your freight and shipping in an effective manner. This presentation slide of key performance indicators of transportation showing cost and profit is useful to show direct cost of goods made by the business such as labor to produce the product, supplies used in manufacture or sale, shipping costs, costs of containers, and overhead costs which are directly related to the manufacture or production activity. Our costs in supply chain management layout is useful to understand the various factors involved in cost sector, failing to identify those will hamper your ability to improve business profitability across different verticals. This slideshow can also be used to view various cost structures involved with our supply chain layout such as supply chain costs, logistics costs, distribution costs or specific functional areas such as warehousing or transport. Give due importance to the doctrine with our Transportation Kpi Dashboard Showing Cost Of Good Sold Logistics Cost And Gross Profit. Convince folks to faithfully abide by it.
People who downloaded this PowerPoint presentation also viewed the following :
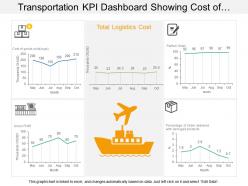
Transportation kpi dashboard showing cost of good sold logistics cost and gross profit with all 6 slides:
Add to your choices with our Transportation Kpi Dashboard Showing Cost Of Good Sold Logistics Cost And Gross Profit. Increase the alternatives at your disposal.


FAQs for Transportation kpi dashboard showing cost of good sold logistics cost
Transportation KPIs include on-time delivery rates, fuel efficiency, vehicle utilization, cost per mile, delivery accuracy, driver performance metrics, and customer satisfaction scores. These indicators streamline operational oversight by identifying bottlenecks, optimizing route planning, and reducing operational costs, with logistics companies and freight organizations finding that comprehensive tracking ultimately delivers improved customer experiences and competitive advantage.
A transportation KPI dashboard improves operational efficiency by providing real-time visibility into fleet performance, route optimization, and resource utilization across all operations. Through centralized data monitoring, transportation companies can identify bottlenecks, reduce fuel costs, and enhance delivery times, while streamlining dispatch decisions and ultimately delivering improved customer satisfaction and competitive advantage.
Real-time data serves as the foundation of transportation KPI dashboards, enabling instant visibility into fleet performance, route efficiency, fuel consumption, delivery times, and operational costs. Through live tracking and automated updates, logistics companies can immediately identify delays, optimize routes, and respond to disruptions, while transportation managers gain the agility to make data-driven decisions that enhance customer satisfaction and competitive advantage.
Organizations customize transportation KPI dashboards by selecting relevant metrics like delivery times, fuel costs, route efficiency, and customer satisfaction scores, then configuring visual layouts and alert thresholds. Through modular dashboard designs, companies across logistics, retail, and manufacturing sectors can prioritize specific performance indicators, integrate real-time data feeds, and create role-based views, ultimately delivering targeted insights that enhance operational efficiency and strategic decision-making.
Visualizing transportation data through dashboards delivers real-time visibility into fleet performance, route optimization, fuel consumption, delivery times, and operational costs. These comprehensive displays enable logistics managers to identify bottlenecks quickly, reduce fuel expenses, improve delivery accuracy, and enhance customer satisfaction, with many transportation companies finding that dashboard analytics ultimately streamline operations and provide significant competitive advantages.
Transportation KPI dashboards assist in route optimization by analyzing real-time traffic data, fuel consumption patterns, delivery timeframes, and vehicle utilization rates across multiple routes simultaneously. Through integrated GPS tracking and predictive analytics, logistics companies streamline delivery schedules, minimize fuel costs, and enhance customer satisfaction, with many transportation firms finding that data-driven routing delivers significantly improved operational efficiency.
Essential fleet performance metrics include vehicle utilization rates, fuel efficiency, maintenance costs, delivery times, driver safety scores, and route optimization effectiveness. These KPIs enable transportation companies to streamline operations by reducing fuel expenses, minimizing downtime, and enhancing delivery reliability, with many logistics organizations finding that comprehensive dashboard monitoring ultimately delivers significant cost savings and improved customer satisfaction.
A transportation KPI dashboard helps assess regulatory compliance by tracking safety metrics, driver hours, vehicle inspections, environmental standards, and audit results in real-time. Through automated monitoring and alert systems, logistics companies can identify compliance gaps, maintain DOT requirements, and generate regulatory reports more efficiently, ultimately reducing violation risks and ensuring operational continuity.
Leading transportation KPI dashboard tools include Tableau, Power BI, QlikView, Looker, and specialized logistics platforms like Oracle Transportation Management and SAP TM. These solutions streamline fleet monitoring, route optimization, and delivery tracking by integrating real-time GPS data, fuel consumption metrics, and driver performance analytics, ultimately delivering enhanced operational visibility and cost reduction for transportation companies.
Organizations integrate financial KPIs into transportation dashboards by incorporating cost-per-mile metrics, fuel efficiency ratios, maintenance expenses, revenue per shipment, and budget variance tracking. These financial indicators enable fleet managers to monitor operational profitability, identify cost-saving opportunities, and optimize resource allocation, with many logistics companies finding that this strategic combination delivers enhanced visibility and improved bottom-line performance.
Fuel efficiency tracking significantly enhances transportation KPI dashboards by enabling real-time monitoring of consumption patterns, cost analysis, and environmental impact metrics. This visibility allows fleet managers to optimize routes, identify underperforming vehicles, and implement driver training programs, ultimately delivering reduced operational costs and improved sustainability performance across transportation operations.
A transportation KPI dashboard supports strategic decision-making by consolidating real-time performance metrics, cost analytics, route optimization data, and operational efficiency indicators into actionable insights. Through comprehensive visibility into delivery times, fuel consumption, and resource utilization, logistics managers can identify optimization opportunities, allocate resources strategically, and enhance service reliability, ultimately delivering competitive advantage and improved customer satisfaction.
Implementation challenges include data integration across multiple systems, ensuring real-time accuracy from various sources, managing complex logistics metrics, and securing stakeholder buy-in for new processes. These obstacles often require strategic technology investments and change management approaches, with many transportation companies finding that phased rollouts and comprehensive training ultimately deliver better adoption rates and more reliable performance insights.
Transportation KPI dashboards typically require real-time or near real-time updates for critical metrics like vehicle locations, delivery status, and route deviations, while operational metrics update hourly or daily. This strategic combination enables fleet managers to respond immediately to disruptions, optimize route efficiency, and enhance customer communications, with many logistics companies finding that frequent updates ultimately deliver competitive advantage and improved service reliability.
Effective transportation KPI visualizations include heat maps for route optimization, gauge charts for fuel efficiency metrics, line graphs for delivery timeline trends, geographic mapping for fleet tracking, and bar charts for cost comparisons. These visual formats streamline complex logistics data by highlighting performance patterns, identifying bottlenecks, and enabling quick decision-making, with many transportation companies finding that strategic dashboard design ultimately delivers faster operational responses and enhanced competitive advantage.
No Reviews