


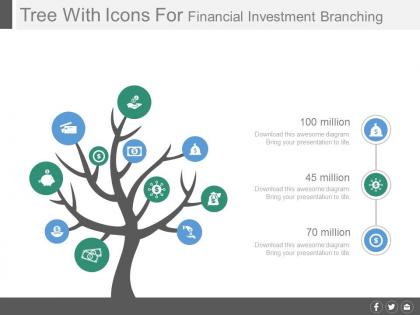
Tree with icons for financial investment branching powerpoint slides




Try Before you Buy Download Free Sample Product
 Impress Your
 Audience
 100%
100% Editable
 Save Hours
 of Time


Managing finance is the most bothersome issue in any business, but it can be dealt aptly using tree with icons for financial investment branching concept. Investment financial issues can be made unambiguous using PowerPoint visuals. Further it correlates with the issues of branch banking along with its advantages and disadvantages. For the safe and sound investment of the funds, the presentation template is an appropriate guide. It also leads the investment analyst towards the track of scanning the environment. Furthermore, the strategies associated to cost reduction and pricing tactics can be made clearer with the use of PPT templates. Investment branching concept helps made various related issues lined up in a sequence. Moreover it paves the way to diverse financial services which further helps generating more revenue. Types and forms of investments to be made is a crucial decision that can be made rational with use of these PowerPoint visuals. Listing of the investments and their level can be further managed with the use of professionally prepared presentation graphics. So, for efficient investment functioning, check out our PowerPoint diagrams. Our Tree With Icons For Financial Investment Branching Powerpoint Slides give you that cutting edge. Your thoughts will get that much sharper.
People who downloaded this PowerPoint presentation also viewed the following :
Tree with icons for financial investment branching powerpoint slides with all 4 slides:
Enjoy the cosy comfort of our Tree With Icons For Financial Investment Branching Powerpoint Slides. They will be excellent companions.



FAQs for Tree with icons for financial investment
**INPUT**: What are the key branches of a financial investment tree diagram? **OUTPUT**: Key branches include asset allocation categories, risk assessment levels, time horizons, investment vehicles, and performance metrics. These branches streamline portfolio management by visualizing diversification strategies, connecting risk tolerance to appropriate investments, and enabling financial advisors to present comprehensive investment pathways, ultimately delivering clearer client communications and more strategic allocation decisions.
A financial investment tree diagram helps visualize the relationship between risk levels and potential returns by mapping different investment paths, scenarios, and their corresponding outcomes through branching structures. This visual approach enables investors to compare various asset classes, from conservative bonds to volatile stocks, while analyzing how diversification strategies, market conditions, and time horizons affect portfolio performance, ultimately delivering clearer decision-making frameworks for optimizing risk-adjusted returns.
**INPUT**: What types of financial instruments can be included in the investment tree branches? **OUTPUT**: Investment tree branches can include stocks, bonds, mutual funds, ETFs, real estate investment trusts, commodities, and alternative investments like private equity. These instruments enable portfolio diversification by risk level, sector, and time horizon, with many financial advisors finding that visual tree structures help clients understand asset allocation strategies, ultimately delivering clearer investment decisions and enhanced portfolio management across different market conditions. **Word count: 60 words**
Visualizing investments in a tree diagram enhances decision-making by mapping potential outcomes, risk scenarios, expected returns, and sequential choices in a clear hierarchical structure. This approach enables investors to compare multiple investment paths simultaneously, assess probability-weighted outcomes, and identify optimal portfolio allocations, with financial advisors and institutional investors finding that visual mapping significantly improves strategic planning and client communication.
Diversifying investments in a tree diagram demonstrates risk mitigation by spreading capital across multiple asset classes, sectors, geographic regions, and time horizons, creating branching pathways that reduce portfolio vulnerability. This visual approach enables investors to identify concentration risks, optimize allocation strategies, and build resilient portfolios, with many financial advisors finding that diversified structures deliver more stable returns while minimizing exposure to market volatility.
A financial investment tree enables investors to systematically map their objectives by branching from broad goals like retirement, wealth building, or income generation into specific targets, timelines, and risk tolerance levels. This structured approach helps investors clarify priorities, align asset allocation with personal circumstances, and create actionable strategies, with many finding that visual mapping ultimately delivers greater portfolio focus and measurable progress toward financial milestones.
Asset classes form the primary branches of a financial investment tree, categorizing investments by characteristics like risk, return potential, liquidity, and market behavior, including equities, fixed income, real estate, commodities, and alternative investments. These classifications enable portfolio managers and financial advisors to strategically allocate resources across diverse sectors, ultimately delivering balanced risk exposure and optimized returns while helping investors navigate increasingly complex markets.
A financial investment tree diagram assists in comparing investment strategies by visualizing potential outcomes, risk probabilities, expected returns, and decision pathways in a structured format. This enables investors to systematically evaluate scenarios like portfolio diversification versus concentrated investments, with many financial advisors finding that clients better understand risk-reward trade-offs and make more informed strategic decisions.
Tree diagrams for long-term financial planning offer enhanced visualization of investment pathways, risk assessment capabilities, scenario modeling, and strategic decision-making frameworks. These visual tools streamline portfolio diversification by mapping multiple investment branches, enabling clearer risk-reward analysis, and facilitating strategic asset allocation, with many financial advisors finding that clients achieve better long-term outcomes through improved understanding and commitment.
Financial investment trees can be customized through risk tolerance levels, investment timeframes, sector preferences, geographical diversification, and capital allocation strategies. While conservative investors might see branches emphasizing bonds and dividend stocks, aggressive profiles feature growth equities and alternative investments, with many financial advisors finding that personalized tree structures enhance client engagement and ultimately deliver more targeted portfolio outcomes.
A financial investment tree diagram facilitates better communication by visually mapping investment hierarchies, risk relationships, portfolio allocations, and decision pathways in an easily digestible format. This visual approach enables financial advisors to clearly demonstrate complex strategies, while clients can better understand diversification benefits, risk-return scenarios, and strategic recommendations, ultimately enhancing trust and informed decision-making.
Common pitfalls include oversimplifying complex investment relationships, failing to account for market volatility and timing factors, neglecting regulatory compliance requirements, and creating rigid structures that can't adapt to changing conditions. Many financial institutions find that overly detailed diagrams become unwieldy while overly simple ones miss critical interdependencies, ultimately compromising strategic decision-making and portfolio optimization efforts.
Technology enhances financial investment tree diagrams through advanced analytics, real-time data integration, interactive visualization tools, and automated scenario modeling. These digital platforms streamline portfolio analysis by enabling dynamic risk assessment, instant market updates, and collaborative decision-making capabilities, with investment firms and wealth management companies finding significantly improved client presentations and faster strategic investment decisions.
Investors should consider risk-adjusted returns, liquidity ratios, market volatility, diversification potential, and time horizon compatibility at each branch. These metrics enable strategic portfolio allocation by evaluating correlation coefficients, beta values, and sector exposure, with many institutional investors finding that systematic branch analysis ultimately delivers enhanced risk management and optimized returns across market cycles.
A financial investment tree aids in assessing market impact by mapping portfolio dependencies, visualizing risk correlations across asset classes, and identifying potential cascading effects from market shifts. Through this structured approach, investors can simulate various market scenarios, evaluate concentration risks, and adjust allocations proactively, with many financial institutions finding that tree diagrams ultimately enhance portfolio resilience and strategic decision-making.
-
Design layout is very impressive.
-
Qualitative and comprehensive slides.