


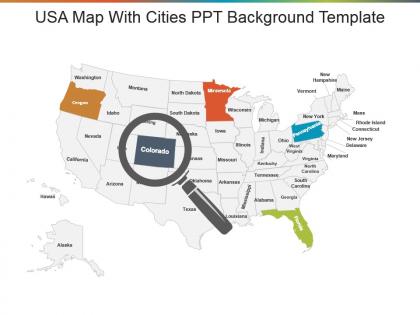
Usa map with cities ppt background template




Try Before you Buy Download Free Sample Product
 Impress Your
 Audience
 100%
100% Editable
 Save Hours
 of Time


Our Usa Map With Cities Ppt Background Template are ready to contribute. They put an effort to make you look better.
People who downloaded this PowerPoint presentation also viewed the following :
Usa map with cities ppt background template with all 5 slides:
Elaborate on cause factors that had an influence with our Usa Map With Cities Ppt Background Template. Be able to investigate the background.

FAQs for Usa map with cities
An effective USA map cities PowerPoint template should include customizable state boundaries, major city markers with population indicators, scalable vector graphics, color-coded regional divisions, and editable text placeholders for demographic data. These features enable presenters to highlight specific metropolitan areas, showcase regional market penetration, and illustrate geographic business strategies, with many organizations finding that visual mapping enhances stakeholder comprehension and strategic decision-making processes.
A USA map cities PPT template enhances audience engagement by providing visual context, geographic reference points, interactive elements, and clear data visualization that makes information more memorable and accessible. These templates enable presenters to showcase regional trends, demographic insights, and location-specific strategies through compelling visuals, ultimately delivering stronger audience connection and comprehension, with many organizations finding that geographic storytelling significantly improves presentation impact.
**INPUT**: What design principles should be considered when creating a USA map cities template? **OUTPUT**: Key design principles include visual hierarchy, color consistency, readable typography, strategic spacing, and data accuracy across all geographic elements. These principles streamline information delivery by ensuring clear city identification, maintaining professional aesthetics, and enabling scalable customization, with many organizations finding that well-designed templates enhance presentation impact while reducing preparation time.
Blue and red combinations work exceptionally well for USA map presentations, with darker blues for major metropolitan areas and vibrant reds for emerging markets or key focus cities. These contrasting schemes enhance visual hierarchy and data comprehension, while gradient variations within the same color family help distinguish regional clusters, ultimately delivering clearer geographic insights and more impactful presentations.
Interactive elements can be integrated through clickable city markers, hover-over information boxes, animated route transitions, embedded videos, and hyperlinked regional data. These features enable presenters to navigate seamlessly between metropolitan areas, showcase real-time statistics, and deliver dynamic content that engages audiences while transforming static geographical data into compelling, actionable business insights.
USA map cities PowerPoint templates can include population density heat maps, economic indicators, demographic breakdowns, transportation networks, and regional performance metrics. These visualizations enable businesses, government agencies, and educational institutions to present market analysis, sales territories, and geographic trends effectively, while helping audiences understand complex spatial relationships and make data-driven decisions across different metropolitan areas.
Users can customize USA map cities templates by modifying colors, fonts, and data visualizations to align with brand guidelines, adjusting city selections and highlighting specific regions relevant to their audience, and incorporating custom icons, legends, or callouts. These customization options enable businesses to create targeted presentations for regional sales teams, market analysis reports, or demographic studies, ultimately delivering more impactful and audience-specific communications.
Best practices for incorporating statistical data into USA map templates include using color-coded legends, proportional symbols, data callouts, interactive hover elements, and clear categorization systems. These visualization techniques enhance audience comprehension by presenting complex urban demographics, economic indicators, and population metrics in digestible formats, with many organizations finding that strategic data placement on metropolitan areas delivers more impactful presentations and informed decision-making.
Incorporating animations enhances USA map cities presentations by highlighting specific regions, guiding audience attention through data progressively, and creating memorable visual storytelling experiences. Through strategic transitions and reveals, presenters can showcase regional comparisons, demographic shifts, and market expansions more effectively, while maintaining audience engagement and delivering clearer insights about geographic business opportunities.
**INPUT**: What software tools are commonly used to create and edit USA map cities PowerPoint templates? **OUTPUT**: Software tools for creating USA map cities PowerPoint templates include Microsoft PowerPoint, Adobe Illustrator, Canva, Lucidchart, and specialized mapping platforms like ArcGIS. These applications streamline template development by offering vector graphics capabilities, customizable city markers, and professional design elements, with many organizations finding that PowerPoint's built-in features combined with design software delivers scalable, branded presentations.
USA map cities templates serve diverse industries by visualizing geographic data, regional strategies, market penetration, demographic trends, and resource allocation across metropolitan areas. In tourism, agencies showcase destination packages and travel routes, while urban planners present development projects, zoning initiatives, and infrastructure improvements, with retail chains and healthcare systems increasingly using these templates to demonstrate expansion strategies and service coverage areas.
SlideTeam offers comprehensive resources including design tutorials, presentation best practices guides, creative layout examples, and industry-specific templates for USA map presentations. These materials help users explore various visualization approaches, color schemes, and data integration techniques, with many professionals finding that combining multiple template styles creates more engaging geographic presentations, ultimately delivering enhanced audience comprehension and stronger visual storytelling impact.
Storytelling with USA map cities templates involves creating narrative arcs through geographic progression, highlighting customer journeys across regions, showcasing expansion timelines, and connecting data points to human experiences. These visual narratives enhance presentations by transforming static location data into compelling business stories, with many organizations finding that geographic storytelling increases audience engagement and makes complex market strategies more memorable and actionable.
Common pitfalls include overcrowding maps with excessive text, using inconsistent color schemes across slides, poor font readability against map backgrounds, and lacking visual hierarchy for city data. These design mistakes confuse audiences and dilute key messages, with many presenters finding that cluttered layouts, misaligned elements, and inadequate contrast ultimately undermine professional credibility and audience engagement.
Accessibility in USA map cities templates requires high color contrast ratios, alternative text descriptions for visual elements, scalable fonts, and screen reader compatibility. Organizations implementing these features across their presentation materials find that inclusive design enhances audience engagement, ensures ADA compliance, and ultimately delivers broader reach while demonstrating corporate responsibility in an increasingly diverse business landscape.
-
Excellent work done on template design and graphics.
-
Good research work and creative work done on every template.