


Valuation Of Securities Powerpoint Presentation Slides





Try Before you Buy Download Free Sample Product
 Impress Your
 Audience
 100%
100% Editable
 Save Hours
 of Time


Get your ideas to jet across with our Valuation Of Securities Powerpoint Presentation Slides. Establish your influence in far flung areas.
People who downloaded this PowerPoint presentation also viewed the following :
Content of this Powerpoint Presentation
Slide 1: This slide introduces Valuation of Securities. State Your Company Name and begins.
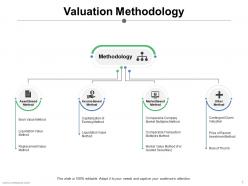
Slide 2: This slide showcases Valuation Methodology which further shows various Methodology Asset Based Method, Book Value Method, Liquidation Value Method, Replacement Value Method, Income Based Method.
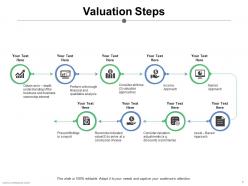
Slide 3: This slide showcases Valuation Steps. You can add your data and make the use of it as per your convienence.
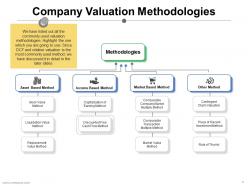
Slide 4: This slide shows Company Valuation Methodologies. We have listed out all the commonly used valuation methodologies. Highlight the one which you are going to use. Since DCF and relative valuation is the most commonly used method, we have discussed it in detail in the later slides
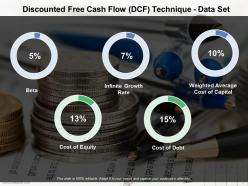
Slide 5: This slide presents Discounted Free Cash Flow (DCF) Technique - Data Set. You can use this as per your requirement.
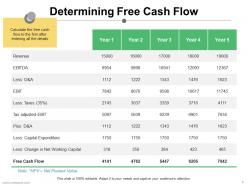
Slide 6: This slide showcases Determining Free Cash Flow. Calculate the free cash flow to the firm after entering all the details
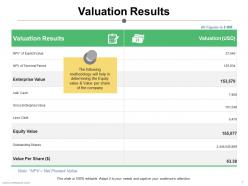
Slide 7: This slide displays Valuation Results.The following methodology will help in determining the Equity value & Value per share of the company
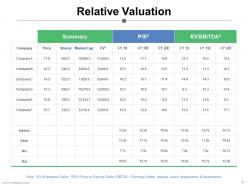
Slide 8: This slide shows Relative Valuation table. You can add the data as per your requirement.
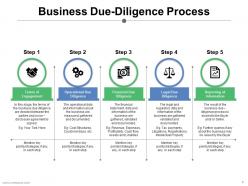
Slide 9: This slide showcases Business Due-Diligence Process with these five steps we have mentioned in this.
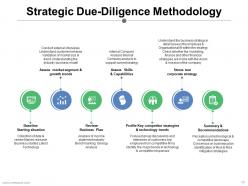
Slide 10: This slide shows Strategic Due-Diligence Methodology. We have also mentioned some of the features that you can use.
Slide 11: This slide is an Icon Slide. You can use it as per requirement.
Slide 12: This is a green tea Break slide to halt. You may change it as per requirement.
Slide 13: This slide is titled Charts & Graphs to move forward.
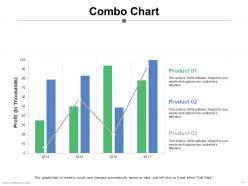
Slide 14: This slide showcases Combo Chart. You can use it as per requirement.
Slide 15: This slide shows Competitive Analysis with Scatter Chart/Radar Chart to compare.
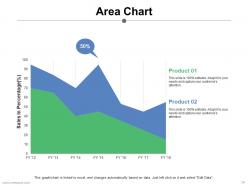
Slide 16: This is an Area Chart slide for product/entity comparison.
Slide 17: This slide is titled Additional Slides to move forward.
Slide 18: This is a Vision, Mission and Goals slide. State them here.
Slide 19: This is an Our Team slide with name, image & text boxes to put the required information.
Slide 20: This is an About Us slide showing Our Company, Value Client, and Premium services as examples.
Slide 21: This slide represents Our Mission. State your mission, goals etc.
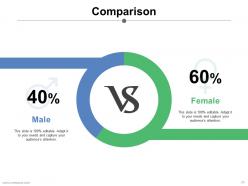
Slide 22: This slide shows Comparison of Positive Factors v/s Negative Factors with thumbsup and thumb down imagery.
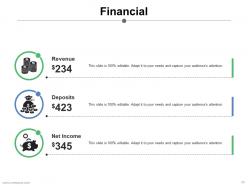
Slide 23: This is a Financial Score slide to show financial aspects here.
Slide 24: This is a Quotes slide to convey message, beliefs etc.
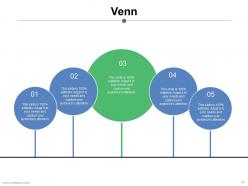
Slide 25: This slide displays a Venn diagram image.
Slide 26: This is a Thank You image slide with Address, Email and Contact number.
Valuation Of Securities Powerpoint Presentation Slides with all 26 slides:
Our Valuation Of Securities Powerpoint Presentation Slides add asset by asset. Ensure good growth of your capital.












FAQs for Valuation Of Securities
So there are three main ways to value a company. DCF is probably the "purest" - you're projecting future cash flows and discounting them back. But honestly, it's only as good as your assumptions, which can be... optimistic lol. Then you've got comps, where you look at how similar companies trade today. Precedent transactions show what buyers actually paid for deals in the past, though deal premiums are all over the place so that gets messy. None of these are perfect on their own - they all have their quirks. That's why most people use two or three methods to get a range that makes sense.
So DCF basically takes all the cash flows a company will generate in the future and converts them to today's money using a discount rate. You project free cash flows for maybe 5-10 years, tack on a terminal value for everything after that, then discount it all back with the company's cost of capital. Honestly, it's a bit of a slog with all the assumptions you have to make. But you get an intrinsic value that doesn't care what the market thinks. Growth projections are where most people screw up—be conservative or you're just fooling yourself. Grab their financials and start building from there.
Here's the deal with bonds - rates and prices move opposite each other. Fed raises rates? Your bond values drop. Rates fall? Bond prices go up. It's honestly like watching a seesaw that never stops. Duration matters huge here though. A 30-year bond will get absolutely crushed when rates spike, while a 2-year barely budges. I learned this the hard way back in '08. Always look at duration before you buy anything - saves you from those "oh shit" moments when Powell starts talking. Short bonds = less drama, long bonds = buckle up.
So market sentiment is basically what pushes stocks away from what they're actually worth. When everyone's feeling good, they'll overpay for pretty average companies - P/E ratios get all inflated and stuff. Fear works the opposite way, creating those sweet deals when people are freaking out (good luck timing that mess though). Growth stocks getting hammered during rate hikes? That's sentiment. Same with meme stocks going crazy on social media. The trick is figuring out which price moves are just emotional noise versus actual changes in the business fundamentals.
So dividend discount models are pretty straightforward - they assume a stock's worth equals all future dividend payments brought back to today's dollars. But here's the thing: you're betting that dividends will grow predictably forever, which honestly almost never happens. Works great for boring, steady companies that actually pay dividends consistently. Growth stocks that reinvest everything? Not so much. The tricky part is nailing down realistic growth and discount rates - mess those up and your whole valuation's off. I wouldn't use it alone though. Combine it with other methods since real markets are way messier than any model assumes.
So P/E ratios are basically stock price divided by earnings per share - super useful for comparing similar companies. High P/E might mean overpriced, low could be a steal. But here's the thing: sometimes cheap stocks are cheap for good reason, you know? Don't compare like Apple to a random mining company though - stick to similar industries and business models. I always use it as my first filter, then figure out why Company A trades at 15x while Company B is at 25x. Usually there's a story there about growth expectations or whatever. It's honestly one of the easiest ways to spot potential bargains.
So intrinsic value is what a stock's actually worth based on the company's real fundamentals - cash flow, earnings, growth potential, all that stuff. Market price doesn't always reflect this "true" value, which is where opportunities come in. Trading below intrinsic value? Could be a steal. Way above? Probably overpriced. Here's the thing though - calculating it involves tons of assumptions, so analysts often get wildly different numbers for the same company. I always use it as my starting point but never rely on it alone. Cross-reference with other methods before you pull the trigger.
So macro stuff basically sets the tone for everything. Interest rates are probably the biggest deal - when they jump up, future cash flows get discounted harder and valuations tank. Inflation chips away at your real returns, GDP growth affects how much companies can actually earn. Then you've got unemployment hitting consumer spending. Currency moves matter if you're international (which, honestly, most people don't think about enough). Here's the thing though - different sectors react totally differently. Tech gets destroyed when rates spike, but utilities might actually do better. Really depends what you're holding.
Honestly, valuing startups is a nightmare. You're dealing with zero financial history and cash flows that are either nonexistent or all over the place. Traditional valuation methods? Forget about it - they're basically worthless here. It's like trying to predict lottery numbers sometimes, no joke. Market conditions flip constantly too, so your valuation from last month might be completely off now. Your best bet is throwing multiple approaches at it - discounted cash flow, market multiples, risk-adjusted NPV - then seeing where they overlap. Don't rely on just one method or you'll get burned.
So CAPM basically figures out what return you should expect from a stock based on how risky it is. You plug that number into your DCF models as the discount rate. Higher beta = more market risk = higher return needed, makes sense right? Look, the model isn't perfect - honestly some of its assumptions are pretty unrealistic. But finance people still use it all the time because it's straightforward and gives you somewhere to start. You can compare CAPM's required return to what you're actually getting to see if a stock's fairly priced or if you're being paid enough for the risk.
So liquidity premiums are basically discounts for securities that are a pain to sell quickly. You can't just dump illiquid stuff whenever you want - might not be buyers around, or you'll get screwed on price. I always start with similar liquid securities as my baseline, then add the discount based on trading volume and how deep the market is. It's honestly one of those things that can totally mess up your valuation if you ignore it. Think of it as pricing in the "oh crap I'm stuck with this" factor - btw, market depth data is usually easier to find than you'd think.
Look, investors absolutely hate uncertainty, so any geopolitical drama usually tanks international markets. Money floods into safe stuff like US bonds while emerging markets get crushed. Wars, trade disputes, sanctions - they all screw with supply chains and make everything unstable. Currency swings make it worse too since political chaos weakens local money. Honestly, it's kind of predictable at this point. Your move? Keep an eye on global tensions and maybe spread your investments across different regions that don't move together. Some hedging wouldn't hurt either.
So fundamental analysis is all about figuring out what a company's actually worth - you're looking at their financials, earnings, how healthy the business really is. Technical analysis is totally different though, it's just studying price charts and volume to predict where stock prices might go next. Honestly, I think fundamental works way better for long-term stuff since you're picking quality companies. Technical's more useful for timing when to jump in or out. My approach? Use fundamentals to choose what to buy, then maybe throw in some technical analysis to nail down better entry points. Works pretty well for me.
So accounting rule changes can totally mess with how you value stocks - they'll switch up the methods, timing, all that stuff. Like suddenly a company has to use fair value instead of historical cost, or handle derivatives differently. IFRS 9 was brutal for this. Stock prices get weird because investors are trying to figure out what the numbers even mean now. Financial ratios change, earnings look different. Always double-check if there've been recent accounting updates when you're doing valuation work. Financial companies especially - they get hit hardest by this stuff.
So basically, when volatility goes up, valuations go down. Why? Because investors want higher returns to deal with the extra risk - it's their compensation for the wild ride. Options pricing models make this super obvious since volatility is literally one of the main inputs, but honestly it affects pretty much everything. Bonds, stocks, you name it. The annoying thing is volatility changes all the time and you can't really predict it perfectly. That's why I always run different scenarios when I'm valuing stuff - saves you from looking like an idiot later.
-
Easy to edit slides with easy to understand instructions.
-
Understandable and informative presentation.