


Year Over Year Organization Growth Playbook Powerpoint Presentation Slides






Try Before you Buy Download Free Sample Product
 Impress Your
 Audience
 100%
100% Editable
 Save Hours
 of Time


Growth achieved by the organization by enhancing its internal strategy is referred to as organic growth. This growth is essential for any organization willing to sustain itself for the long term. Thus, grab our insightful Year over Year Organization Growth Playbook, a detailed playbook to serve as a blueprint for your organization and help you achieve organic growth. The following presentation slide is helpful for organizations intending to attain growth organically through internal strategies. This playbook is divided into 4 major parts these parts serve as a step-by-step guide for the organization. This presentation also provides an overview of organic growth as a strategy. It also helps understand the impact of organic growth by highlighting its critical advantages. The second part of the playbook highlights key stats of how organic growth can help your organization. The third part displays the key strategies that can help your organization attain organic growth. These strategies can be selling your product to existing customers, new customers, etc. The last part of this playbook focuses on identifying the critical KPIs that help the organization track its growth. Get access now.
People who downloaded this PowerPoint presentation also viewed the following :
Content of this Powerpoint Presentation
Slide 1: This slide introduces Year Over Year Organization Growth Playbook. State your company name and begin.
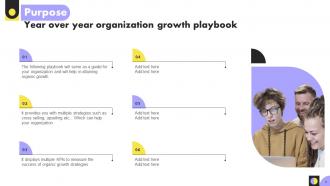
Slide 2: This slide presents purpose of the playbook.
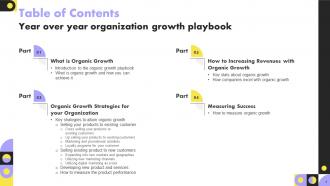
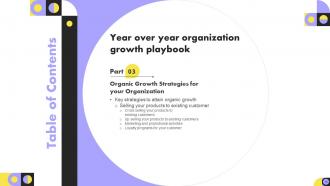
Slide 3: This slide presents Table of Content for the presentation.
Slide 4: This slide depicts title for two topics that are to be covered next in the template.
Slide 5: This slide provide an overview of the playbook as it displays an introduction to organic growth.
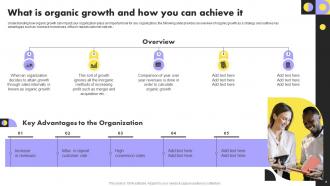
Slide 6: This slide provides an overview of organic growth as a strategy and outlines key advantages such as: increase in revenues, influx in repeat customer rate etc.
Slide 7: This slide depicts title for two topics that are to be covered next in the template.
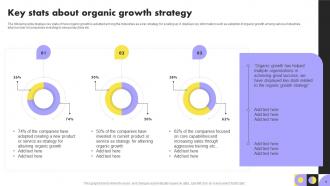
Slide 8: This slide displays key stats of how organic growth is adopted among the Industries as a key strategy for scaling up.
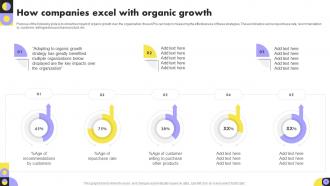
Slide 9: This slide is to show the impact of organic growth over the organization, these KPIs can help in measuring the effectiveness of these strategies.
Slide 10: This slide depicts title for one topic that is to be covered next in the template.
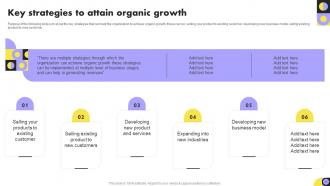
Slide 11: This slide show the key strategies that can help the organization to achieve organic growth, these can be: selling your product to existing customer, etc.
Slide 12: This slide depicts title for five topics that are to be covered next in the template.
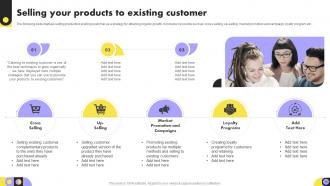
Slide 13: This slide displays selling products to existing customer as a strategy for attaining organic growth.
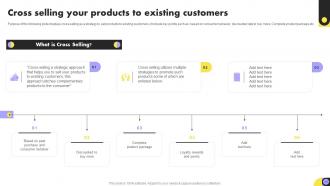
Slide 14: This slide displays cross selling as a strategy to sell products to existing customers.
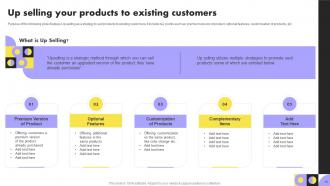
Slide 15: This slide displays Up-selling as a strategy to sell products to existing customers.
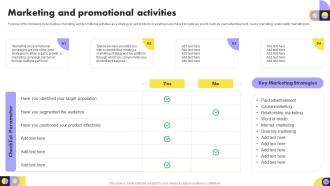
Slide 16: This slide displays marketing and promotional activities as a strategy to sell products to existing customers.
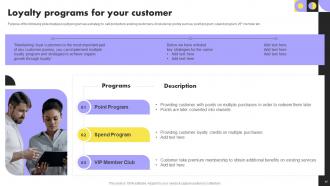
Slide 17: This slide displays Loyalty program as a strategy to sell products to existing customers.
Slide 18: This slide depicts title for four topics that are to be covered next in the template.
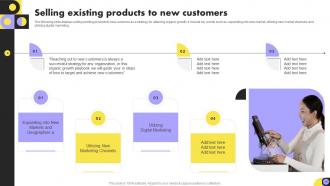
Slide 19: This slide displays selling existing products to new customer as a strategy for attaining organic growth.
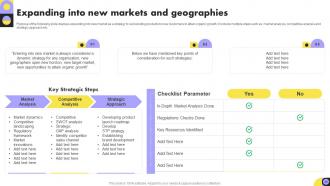
Slide 20: This slide displays expanding into new market as a strategy to sell existing products to new customers to attain organic growth.
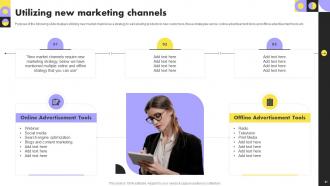
Slide 21: This slide displays utilizing new market channel as a strategy to sell existing products to new customers.
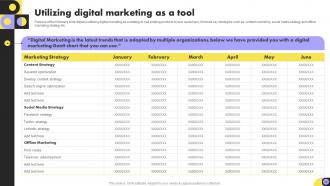
Slide 22: This slide displays utilizing digital marketing as a strategy to sell existing products to new customers.
Slide 23: This slide depicts title for two topics that are to be covered next in the template.
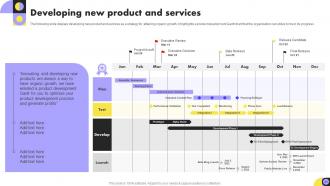
Slide 24: This slide displays developing new product and services as a strategy for attaining organic growth.
Slide 25: This slide show multiple metrics that the organization can use to track performance of their product.
Slide 26: This slide depicts title for one topic that is to be covered next in the template.
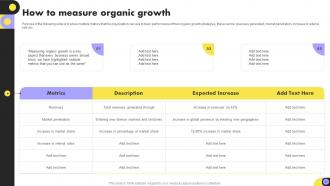
Slide 27: This slide show multiple metrics that the organization can use to track performance of their organic growth strategies.
Slide 28: This slide contains all the icons used in this presentation.
Slide 29: This slide is titled as Additional Slides for moving forward.
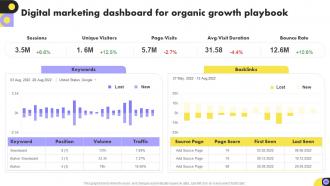
Slide 30: This slide exhibits Digital Marketing Dashboard for Organic Growth Playbook.
Slide 31: This slide shows SWOT describing- Strength, Weakness, Opportunity, and Threat.
Slide 32: This is About Us slide to show company specifications etc.
Slide 33: This is Our Mission slide with related imagery and text.
Slide 34: This is Our Team slide with names and designation.
Slide 35: This slide contains Puzzle with related icons and text.
Slide 36: This is an Idea Generation slide to state a new idea or highlight information, specifications etc.
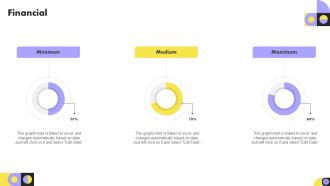
Slide 37: This is a Financial slide. Show your finance related stuff here.
Slide 38: This slide shows Roadmap for process flow.
Slide 39: This is a Timeline slide. Show data related to time intervals here.
Slide 40: This slide provides 30 60 90 Days Plan with text boxes.
Slide 41: This is Our Target slide. State your targets here.
Slide 42: This is a Thank You slide with address, contact numbers and email address.
Year Over Year Organization Growth Playbook Powerpoint Presentation Slides with all 47 slides:
Use our Year Over Year Organization Growth Playbook Powerpoint Presentation Slides to effectively help you save your valuable time. They are readymade to fit into any presentation structure.













FAQs for Year Over Year Organization Growth Playbook
So you basically just need two numbers - what you're measuring now vs the same period last year. Then do the math: (Current - Previous) ÷ Previous × 100. Done. Most companies obsess over revenue growth, but honestly? Track whatever actually moves the needle for you - customer count, sales, even costs if that's your focus right now. Just don't be that person comparing Q3 to Q2 and calling it year-over-year growth. Same periods only. Oh, and build yourself a simple spreadsheet template today. Trust me on this one - you'll thank yourself when your boss randomly asks for these numbers at 4pm on a Friday.
Here's what I'd do - grab some industry reports from IBISWorld or McKinsey first. Your trade association probably puts out annual stuff too. Skip the unicorn companies though, they'll mess with your head. Look for businesses actually similar to yours in size and market. PitchBook works, or you can dig through public company earnings if you're feeling ambitious. Oh, and don't compare your bootstrapped startup to some VC-backed competitor - that's just setting yourself up for disappointment. Get 3-5 solid data points and you'll have a much better sense of where you actually stand.
Ugh, seasonal swings are the worst - your numbers get totally screwed when you're comparing against some weird spike from last year. Like remember when marketing did that insane campaign that made everything look terrible this year? External stuff messes with you too. Holidays shift around, the economy does weird things, product launches happen. Honestly, I always try to dig into what was actually happening behind those numbers. Rolling averages help smooth out the crazy fluctuations, but yeah - context is everything when you're trying to make sense of year-over-year data.
Yeah, YoY is perfect for this actually. You're comparing December to December, January to January, etc. - so all that seasonal stuff basically cancels out. Way better than month-to-month where you'll get these weird spikes just because people buy more stuff in December or whatever. The main thing is staying consistent with your date ranges. Oh, and watch for any random one-off events that mess up a specific period. But honestly? YoY gives you such a cleaner view of what's actually happening with growth trends.
Dude, retention is everything for YoY growth. It costs way less to keep customers you already have vs finding new ones - like 5x cheaper or something crazy. Your existing customers become this solid revenue foundation that just keeps growing. Plus they usually buy more stuff over time once they trust you. Honestly, I used to think acquisition was sexier but retention is where the real money is. Track your retention by cohort and figure out when people typically bail. That's where you'll find the biggest wins. Way better than constantly scrambling for new customers every month.
Look at your last 3-4 years of quarterly data first - that's where the gold is. YoY trends help you catch business patterns early. Notice Q4 always crushes it? Stock up on inventory and hire beforehand. Weak periods are actually great for testing new stuff or cutting costs. Don't get fooled by one amazing year though (learned that the hard way). Multiple years tell the real story. Use what you find for realistic budgets and timing product launches. Honestly, most people skip this step and wonder why they're always scrambling.
Honestly just start with Excel or Google Sheets - set up columns for this year vs last year, then calculate the percentage change. Pretty straightforward stuff. Spreadsheets get chaotic though when you're juggling tons of different metrics. If you want something cleaner, Tableau or Power BI are solid choices for visualizing trends. Google Analytics works too if it's web stuff you're tracking. But here's the thing - doesn't matter how fancy your dashboard looks if you won't actually keep it updated. Pick whatever you'll stick with consistently.
YoY growth shows if a company's actually getting somewhere or just stuck in place. It smooths out all that seasonal weirdness - like retail always crushing Q4 because of holidays, you know? Way better than just looking at quarter-to-quarter stuff. Investors love it for comparing different companies and seeing if CEOs are bullshitting about their big plans. Stock prices start making more sense when you check this metric. Don't get fooled by one amazing year though. I always look at like 3-4 years minimum to see what's really happening.
Dude, charts are a game changer for YoY stuff. Nobody wants to stare at spreadsheet rows trying to figure out what's happening. Line charts work great for showing growth over time, and bar charts are clutch when you need to compare periods. I swear, I've watched so many people zone out during presentations until someone finally puts up a visual. Then suddenly everyone gets it. Your brain just processes the trends and weird spikes way faster when you can actually see them. Start simple - throw your main numbers into a basic line chart covering the last couple years. Makes everything click.
Yeah, so negative YoY growth means you're doing worse than last year - your business is basically shrinking. Not ideal, obviously. Investors get nervous fast when they see this stuff, and honestly, I don't blame them. Could be a temporary thing though - maybe seasonal weirdness or some random event messed up your numbers. Or it might be something bigger like losing customers to competitors. Either way, you gotta figure out what's causing it pretty quickly. Don't freak out, but definitely start digging into the data to see if this is just a rough patch or if you need to pivot your whole strategy.
Look, when those YoY numbers drop, they're basically telling you exactly where to focus next. Growing fast somewhere? Throw more money and people at it. Honestly, I've watched so many teams ignore the obvious signals because they're married to their original plan. If something's tanking, your marketing's probably off or the product isn't quite right yet. Don't be stubborn about it. Find your biggest gaps first, then figure out what you can actually change next quarter. The data doesn't care about your feelings.
Dude, YoY comparisons get totally screwed up by industry stuff you wouldn't think about. Retail companies have those insane holiday spikes that make everything look weird. Tech is all over the place with product launches - one quarter they're killing it, next quarter looks terrible. Healthcare and finance? One regulatory change and boom, their numbers are either amazing or trash overnight. Manufacturing gets hit hard when commodity prices swing around. I learned this the hard way looking at energy stocks last year. Weather patterns mess with agriculture and tourism too, which is kinda obvious but still catches people off guard. Always check what industry drama might be hiding the real story behind those growth numbers.
You really need the bigger picture here - YoY alone is pretty useless honestly. Like, 50% growth sounds amazing until you find out your company usually does 80% every year. Or that "terrible" 10% might actually be solid if your whole industry is tanking. I've watched teams completely freak out or get way too excited over numbers that made zero sense without context. Pull at least 3 years of data so you can see what's actually a trend vs just random noise. One year tells you basically nothing about where things are really heading.
Tell a story, not just data dump percentages on them. Start with the "why" behind your numbers - what market conditions or initiatives actually drove the growth? Charts help but keep them simple. I've seen too many presentations where people's eyes just glaze over from number overload, honestly. Compare your results against what you originally projected or industry benchmarks. Here's the thing though - don't just report what happened. Connect it to what's coming next and what decisions the team needs to make. End with clear next steps they can actually act on.
Look at your YoY growth across different segments - that's where the gold is hiding. Software up 25% but hardware only 3%? No brainer where to put your money. Growth patterns show you exactly where market momentum is going, and honestly, it's one of the clearest signals you can get. Compare your numbers against competitors too - if you're outpacing them somewhere, you've found your sweet spot. I'd track this stuff monthly because trends can shift pretty quick. It's basically like following a treasure map, except the X marks actual revenue opportunities.
-
“Immediate response, professional support, and effective solutions that were customized and immediately provided. Well done- Thank you!”
-
SlideTeam is my one-stop solution for all the presentation needs. Their templates have beautiful designs that are worth every penny!