


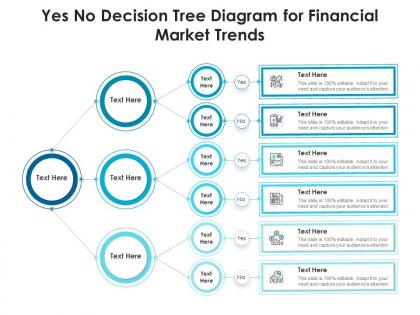
Yes no decision tree diagram for financial market trends infographic template




Try Before you Buy Download Free Sample Product
 Impress Your
 Audience
 100%
100% Editable
 Save Hours
 of Time


Our Yes No Decision Tree Diagram For Financial Market Trends Infographic Template are topically designed to provide an attractive backdrop to any subject. Use them to look like a presentation pro.
People who downloaded this PowerPoint presentation also viewed the following :
Yes no decision tree diagram for financial market trends infographic template with all 2 slides:
Use our Yes No Decision Tree Diagram For Financial Market Trends Infographic Template to effectively help you save your valuable time. They are readymade to fit into any presentation structure.
FAQs for Yes no decision tree diagram for financial market
So decision trees have three main parts you should know. There's the **root node** at the top - that's your starting point with the whole dataset. **Internal nodes** come next and they split your data based on different features. **Leaf nodes** are at the bottom giving you the final predictions. The **branches** connect everything together, showing how you get from one decision to another. It's basically like a flowchart that keeps asking "okay, but what if this happens instead?" Honestly, the trickiest part is figuring out what question your root node should ask first since that shapes your whole tree. But once you get that, the rest flows pretty naturally.
Hey! So decision trees are actually pretty smart about this. With categorical stuff like colors, they'll split into groups - maybe "red vs everything else." Continuous data is different though - the tree finds cutoff points like "age under 35" or "income over 50K." Honestly, the coolest part is you barely have to prep your data. Most algorithms just figure it out automatically. Just make sure your categories aren't coded as numbers or the tree gets confused and treats "blue=1, red=2" like actual math. Been there, done that mistake! The tree basically asks totally different questions depending on what type of data you're feeding it.
Honestly, decision trees are amazing when you need to actually explain what your model is doing. You can trace every single decision path, which stakeholders love. They work with any type of data - no preprocessing headaches or scaling nonsense. Outliers? They barely faze them. The cool part is they find the important features for you and don't care about linear relationships. Yeah, they overfit like crazy sometimes, but pruning usually fixes that. I'd go with a decision tree whenever explainability matters more than squeezing out every last bit of accuracy.
So there are basically two ways to handle this. Pre-pruning stops your tree while it's growing - like setting max depth or min samples per leaf. Post-pruning is different though - you build the whole tree first, then cut back branches that hurt performance on validation data. Takes more computing power but honestly works way better most of the time. The whole point is avoiding overfitting to your training set. I'd go with post-pruning + cross-validation if you're just starting out. It's more work but you'll get cleaner results.
So the big ones are **Gini impurity** and **entropy** - both measure how mixed up your data gets at each split. There's also **chi-square** for categorical stuff and **mean squared error** when you're doing regression trees. Gini's faster to calculate, entropy picks up on changes better, but honestly? The difference is pretty tiny most of the time. Oh, and Gini's usually the default in most libraries anyway. Your tree just picks whatever split reduces the messiness the most. I'd stick with Gini unless you've got a specific reason to switch - one less thing to overthink, you know?
Decision trees are honestly pretty bad with linear relationships and high-dimensional stuff. They'll overfit like mad when your data's noisy or has complex feature interactions. Take house prices vs square footage - instead of a smooth prediction, you get these janky stepwise jumps that look weird. Also they're super unstable. Change a few training samples and boom, completely different tree structure. Random Forest or XGBoost work way better for this kind of messy data - much more reliable results.
So basically you're taking a bunch of decision trees and letting them vote on the answer - way smarter than trusting just one tree to get it right. Each tree trains on different random chunks of your data and features, which stops that annoying overfitting problem single trees always have. For classification, whichever answer gets the most votes wins. Regression just averages everything out. Honestly, it's kind of genius how much more accurate this makes things compared to solo trees. I'd start with like 100-500 trees and see how it goes.
Oh yeah, decision trees are super prone to overfitting! They'll just keep growing deeper and deeper, basically memorizing every weird data point in your training set instead of learning actual patterns. It's like they create this crazy specific rule for every outlier - honestly drives me nuts sometimes. When you test on new data, performance tanks because the tree got way too obsessed with the training examples. You can fix it though - set max depth limits, require minimum samples per leaf, or prune afterwards. Just don't let them run wild and always test on holdout data first.
So decision trees deal with missing data in a few ways. Most use surrogate splits - they find backup variables that act like the main one when data's missing. CART does this pretty well. You could also fill in missing values beforehand with medians or modes, that works too. Some algorithms will actually send missing values down both branches and weight the outcomes, which honestly feels weird but apparently it's effective? Different libraries handle it differently though - sklearn does one thing, xgboost another. I'd check whatever you're using since they're all a bit different about it.
So decision trees basically tell you which features matter most by measuring how much each one reduces impurity when making splits. Scikit-learn makes this easy - just check the `feature_importances_` attribute after training. Higher scores mean that feature does a better job separating your data cleanly. You can also look at split frequency and depth (early splits are usually more important). Honestly though, I wouldn't rely on just this method alone. These scores are relative to your specific tree, so you'll want to combine them with other feature selection approaches to get the full picture of what's actually driving your model.
So entropy measures how mixed up your data is at each point in the decision tree. The algorithm picks splits that give you the biggest information gain - basically reducing uncertainty as much as possible. It's like cleaning your room, you tackle the messiest areas first to make real progress. Short sentences work better here. Each split creates more organized groups until you end up with clean categories. Honestly, I used to overthink this concept way too much when I started. Lower entropy means your data's well-sorted, which leads to better predictions when you're actually using the model.
For decision tree viz, matplotlib with sklearn's plot_tree works pretty well - just basic but gets the job done. Graphviz is honestly way better though, especially if you're showing this to anyone else. Makes much cleaner diagrams that don't look like garbage. There's also draw.io if you want to go the manual route, which I've done before when I needed something super specific. Just don't make your trees too deep or they'll be impossible to read. I learned that the hard way! Export as PNG and you're good to go.
Focus on your key features first and don't let the tree get too deep - that's usually when it starts memorizing instead of learning. I'd set minimum samples per leaf around 20-50 to dodge those random outliers that mess everything up. Cross-validation works great for tuning stuff. Pruning afterward helps clean things up, kinda like fixing a messy first draft. Oh, and definitely visualize the final tree if you can. If you can't explain why it made a split to someone else, probably means it's garbage. Test on data it hasn't seen before - that's the real test of whether it'll actually work.
Oh man, decision trees are everywhere! Healthcare uses them constantly - doctors love explaining diagnosis paths to patients instead of just saying "the computer said so." Finance is obsessed with them too for credit scores and fraud stuff because regulators demand transparency. Marketing teams eat this up for customer targeting. Honestly, the coolest part is you can actually trace back why any decision got made. No mystery black box nonsense. If you're dealing with regulations or need to justify choices to your boss, that's probably where I'd start. Way easier than explaining some complex algorithm nobody understands.
Cross-validation is your best friend here - try different max depths like 3, 5, 7, 10 and see what gives the best validation score. Honestly, shallow trees around 3-5 depth work better than you'd think, plus they're way easier to explain to people later. I'd start with depth 5 personally. Keep training deeper if your validation accuracy improves, but stop when that gap between training and validation scores starts getting ugly. It's kinda trial and error at first but you'll figure out the patterns pretty quick.
-
Easily Understandable slides.
-
Use of icon with content is very relateable, informative and appealing.
-
Helpful product design for delivering presentation.
-
Design layout is very impressive.
-
Easily Understandable slides.