

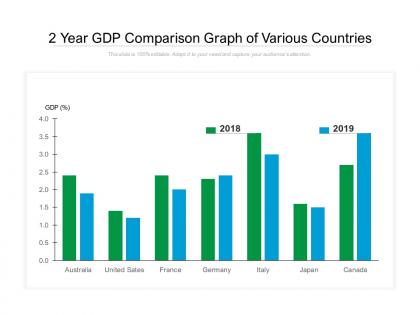
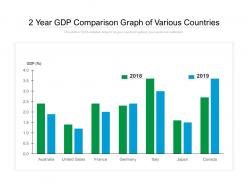
2 year gdp comparison graph of various countries




Try Before you Buy Download Free Sample Product
 Impress Your
 Audience
 100%
100% Editable
 Save Hours
 of Time


Guide them along with our 2 Year GDP Comparison Graph Of Various Countries. Encourage them to advance forward.
People who downloaded this PowerPoint presentation also viewed the following :
2 year gdp comparison graph of various countries with all 6 slides:
Our 2 Year GDP Comparison Graph Of Various Countries can be an excellent guide. They will advance in the correct direction.

FAQs for 2 year gdp comparison graph
Primary factors influencing GDP growth include investment levels, technological innovation, human capital development, infrastructure quality, and institutional stability. These elements work synergistically, with countries like Singapore and South Korea demonstrating how strategic combinations of education investment, technology adoption, and sound governance ultimately deliver sustained economic expansion and competitive positioning.
GDP per capita reveals regional living standards by dividing total economic output by population, showing average income levels, purchasing power, and resource availability per person. This metric enables meaningful comparisons between regions with different population sizes, with developed economies like Western Europe typically showing higher per capita figures than developing regions, ultimately helping policymakers and businesses assess market opportunities and economic development priorities.
Economic policies impact GDP performance through fiscal measures like government spending and taxation, monetary policies controlling interest rates and money supply, and regulatory frameworks governing trade and business operations. These policy tools enable governments to stimulate growth during downturns, control inflation during expansions, and enhance long-term competitiveness, with many economies finding that strategic policy combinations ultimately deliver sustained GDP growth and economic stability.
GDP comparison helps identify emerging markets by revealing rapid growth rates, expanding middle-class populations, increasing industrial output, and rising consumer spending patterns across sectors like technology, healthcare, and infrastructure. Countries showing consistent GDP acceleration, particularly those transitioning from agriculture to manufacturing economies, often present significant investment opportunities, with many investors finding that sustained growth trajectories signal favorable market conditions and competitive returns.
Nominal GDP measures economic output using current market prices, while real GDP adjusts for inflation using constant base-year prices, providing a more accurate picture of actual economic growth. This distinction enables policymakers, investors, and businesses to distinguish between genuine productivity increases and mere price inflation, with many financial institutions and government agencies finding that real GDP delivers clearer insights for strategic planning and resource allocation.
Exchange rates significantly impact GDP calculations by determining how countries' economic outputs translate into comparable currency values, affecting international rankings and economic assessments. When currencies fluctuate, GDP figures can appear dramatically different despite unchanged domestic production levels, with economies like Japan or Germany seeing their dollar-denominated GDP rise or fall based purely on currency movements, ultimately creating challenges for accurate cross-border economic analysis and investment decisions.
Natural resources significantly influence GDP outcomes through export revenues, industrial development, employment generation, and foreign investment attraction. Countries like Norway, Saudi Arabia, and Australia demonstrate how strategic resource management enhances economic growth, though diversification remains crucial to minimize volatility risks and ensure sustainable long-term prosperity in increasingly dynamic global markets.
GDP comparisons can be misleading because they don't account for income inequality, cost of living differences, population size variations, or quality of life factors like healthcare and education access. While Country A might have higher total GDP than Country B, its citizens could experience lower purchasing power, greater wealth disparity, and reduced social services, ultimately delivering less actual prosperity and economic wellbeing.
Population density creates complex effects on GDP growth, with high-density areas enabling economies of scale, knowledge sharing, and infrastructure efficiency, while also potentially causing congestion and resource strain. Countries like Singapore and South Korea demonstrate how strategic urban planning can harness density advantages, ultimately delivering enhanced productivity and innovation clustering that accelerates economic development.
GDP often presents both challenges and opportunities for environmental sustainability, as traditional measurements prioritize economic growth over resource conservation, waste reduction, and ecological impact. While higher GDP can enable investments in clean technologies and sustainable infrastructure, many countries are increasingly adopting alternative metrics like Green GDP and circular economy indicators, ultimately balancing economic progress with environmental stewardship and long-term resource management.
Technological innovation influences GDP comparisons through productivity gains, digital economy contributions, automation improvements, and new industry creation across different countries. Nations investing heavily in AI, robotics, and digital infrastructure often demonstrate higher GDP growth rates, with countries like South Korea and Singapore leveraging technology adoption to enhance manufacturing efficiency, streamline services, and ultimately deliver competitive economic advantages in global markets.
GDP can be adjusted for income inequality through measures like the Gini coefficient integration, median household income weighting, and quintile-based distribution analysis. These adjustments enable policymakers and economists to assess economic performance more comprehensively, with many financial institutions and development organizations finding that inequality-adjusted GDP metrics deliver clearer insights into sustainable growth patterns and social stability indicators.
GDP's strengths include standardized international comparisons, comprehensive economic output measurement, and reliable trend tracking for policy decisions. However, it ignores income inequality, environmental degradation, unpaid work, and quality of life factors, with many economists finding that combining GDP with social and environmental indicators delivers more comprehensive economic assessments for strategic planning.
Cultural differences significantly shape economic systems through varying approaches to entrepreneurship, social welfare priorities, labor market structures, and government intervention levels. Countries with individualistic cultures often emphasize market-driven growth and innovation, while collectivist societies frequently prioritize social cohesion and long-term stability, with many nations finding that strategic combinations of both approaches ultimately deliver sustainable GDP growth and competitive economic positioning.
Alternative GDP measures include Gross National Happiness, Human Development Index, Genuine Progress Indicator, Better Life Index, and Green GDP, which incorporate social equity, environmental sustainability, and quality of life metrics. These comprehensive frameworks enable governments to assess healthcare outcomes, education access, income distribution, and environmental health, with many developed nations finding that strategic policy decisions driven by well-being indicators ultimately deliver more balanced societal progress.
No Reviews