


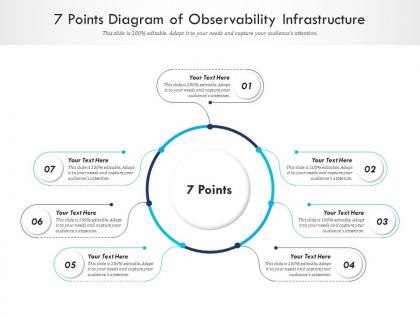
7 points diagram of observability infrastructure infographic template




Try Before you Buy Download Free Sample Product
 Impress Your
 Audience
 100%
100% Editable
 Save Hours
 of Time


Our 7 Points Diagram Of Observability Infrastructure Infographic Template are topically designed to provide an attractive backdrop to any subject. Use them to look like a presentation pro.
People who downloaded this PowerPoint presentation also viewed the following :
7 points diagram of observability infrastructure infographic template with all 2 slides:
Use our 7 Points Diagram Of Observability Infrastructure Infographic Template to effectively help you save your valuable time. They are readymade to fit into any presentation structure.
FAQs for 7 points diagram of observability
Key components of an effective observability infrastructure include distributed tracing, metrics collection, log aggregation, alerting systems, and visualization dashboards. These technologies streamline operations by enabling real-time monitoring, faster incident response, and proactive issue detection, with many enterprises finding that comprehensive observability ultimately delivers reduced downtime, improved customer experiences, and significant operational efficiency gains.
Observability differs from traditional monitoring by providing comprehensive insights into system behavior through logs, metrics, traces, and events, rather than just predefined alerts and dashboards. This strategic approach enables organizations to understand unknown failures, debug complex distributed systems, and proactively identify performance bottlenecks, ultimately delivering faster incident resolution and improved system reliability.
Logs, metrics, and traces form observability's foundational pillars, providing comprehensive system visibility through detailed event records, quantitative performance measurements, and request journey tracking across distributed services. These complementary data types enable organizations to correlate incidents, identify bottlenecks, and troubleshoot issues efficiently, with many enterprises finding that this strategic combination ultimately delivers faster incident resolution and enhanced operational reliability.
Organizations measure observability infrastructure effectiveness through key metrics like mean time to detection, resolution speed, alert accuracy, system uptime, and performance bottleneck identification rates. Financial services and e-commerce companies increasingly track these indicators alongside operational efficiency gains, with many finding that comprehensive measurement frameworks ultimately deliver faster incident response, reduced downtime costs, and enhanced customer experiences.
Teams face challenges including data volume overwhelm, tool integration complexity, high storage costs, alert fatigue, and inconsistent monitoring across microservices. These obstacles often lead to blind spots in system performance, delayed incident response, and increased operational overhead, with many organizations finding that strategic tool consolidation and automated correlation significantly streamline observability while reducing costs.
Observability improves incident response times by providing real-time system visibility, automated alerting, and comprehensive performance metrics that enable rapid problem identification and resolution. Through distributed tracing, log aggregation, and performance monitoring, IT teams can pinpoint root causes within minutes rather than hours, ultimately reducing downtime costs and enhancing customer experiences.
Businesses can utilize observability to enhance DevOps processes by implementing comprehensive monitoring, distributed tracing, and real-time analytics that provide deep visibility into application performance and system behavior. Through observability platforms, organizations streamline incident response, accelerate troubleshooting, and optimize deployment pipelines, with many financial services and e-commerce companies finding that enhanced visibility ultimately delivers faster recovery times and improved operational efficiency.
Modern observability solutions commonly use distributed tracing tools like Jaeger and Zipkin, monitoring platforms such as Prometheus and Grafana, log management systems including ELK Stack and Splunk, and APM solutions like New Relic and Datadog. These technologies work together by collecting telemetry data, visualizing performance metrics, and correlating events across microservices, enabling organizations to proactively identify bottlenecks and optimize system reliability.
Best practices for structuring logs include implementing consistent formatting with structured JSON or key-value pairs, incorporating correlation IDs for request tracing, adding contextual metadata like user IDs and service versions, using standardized log levels, and including meaningful timestamps. These approaches streamline troubleshooting by enabling faster query processing, automated analysis, and cross-service correlation, with many engineering teams finding that structured logging significantly reduces incident resolution times while enhancing system visibility.
Observability tools aid in identifying performance bottlenecks by providing real-time monitoring, distributed tracing, and comprehensive metrics analysis across entire system architectures. These platforms enable organizations to pinpoint slow database queries, network latencies, and resource constraints through detailed visibility dashboards, ultimately delivering faster incident resolution and enhanced application performance for improved user experiences.
**INPUT**: What security considerations should be taken into account for observability infrastructure? **OUTPUT**: Observability infrastructure security considerations include data encryption, access controls, sensitive data filtering, secure storage protocols, and compliance alignment with regulatory standards. These security measures streamline monitoring while protecting critical information, with many financial services and healthcare organizations finding that strategic security integration ultimately delivers enhanced operational visibility and regulatory compliance without compromising system transparency. **Word count: 54 words**
Observability enhances system reliability by enabling proactive monitoring, real-time anomaly detection, and rapid root cause analysis across distributed architectures. Through comprehensive logging, metrics collection, and distributed tracing, organizations can identify performance bottlenecks, prevent cascading failures, and minimize downtime, with many enterprises finding that robust observability reduces incident response times by 60-80%.
Organizations should prioritize metrics including response times, error rates, throughput, resource utilization, and business transaction flows for effective observability infrastructure. These comprehensive metrics enable teams to streamline incident detection, enhance system performance, and minimize downtime, with many enterprises finding that strategic monitoring ultimately delivers faster resolution times and improved customer experiences.
Cloud-native architectures leverage observability through distributed tracing, real-time monitoring, automated alerting, centralized logging, and performance analytics across microservices and containers. These capabilities enable organizations to identify bottlenecks, predict failures, and optimize resource allocation seamlessly, with many enterprises finding that comprehensive observability delivers faster incident resolution, improved system reliability, and enhanced user experiences.
Key trends shaping observability infrastructure include AI-driven automated anomaly detection, unified observability platforms, real-time streaming analytics, cloud-native monitoring solutions, and intelligent alerting systems. These technologies streamline operations by reducing manual oversight, enhancing predictive capabilities, and delivering comprehensive visibility across distributed systems, with many organizations finding that integrated approaches ultimately provide faster incident resolution and improved operational efficiency.
-
Top Quality presentations that are easily editable.
-
Great experience, I would definitely use your services further.
-
Really like the color and design of the presentation.
-
Visually stunning presentation, love the content.
-
Use of icon with content is very relateable, informative and appealing.
-
Great designs, really helpful.
-
Unique design & color.