


Agile operations for optimizing tasks and enhancing team performance powerpoint presentation slides


Try Before you Buy Download Free Sample Product
 Impress Your
 Audience
Editable
of Time


The Agile technique, which employs an iterative framework, is based on the interaction of self-organizing teams of individuals with the cross-functional skillsets necessary to produce tested, functioning software. The most often utilised programming approaches – test-driven development, code refactoring, continuous integration, simple code design, pair programming, a shared codebase, and a single coding standard – all contribute to the software's quality, adaptability, and long-term viability. SlideTeam’s agile technology PowerPoint templates can help you and your team get up to speed quickly on the basics of agile operations. With our extensive set of templates, you can customize presentations for all aspects of agile development, from product planning to daily standups. Plus, we have templates for Scrum boards, burn down charts, and more. So don’t wait – download our Agile technology ppt templates now.
People who downloaded this PowerPoint presentation also viewed the following :
Content of this Powerpoint Presentation
Slide 1: This slide introduces Agile Operations for Optimizing Tasks and Enhancing Team Performance. State your Name and begin.
Slide 2: This slide shows Agenda for Agile Operations.
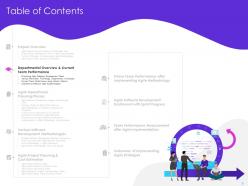
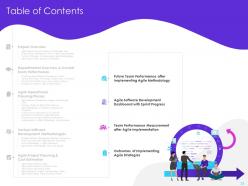
Slide 3: This slide displays Table of Contents.
Slide 4: This slide displays Table of Contents.
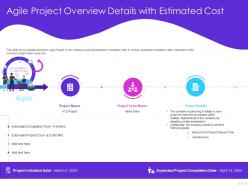
Slide 5: This slide shows details about the Agile Project in the company such as estimated completion time in weeks, estimated completion date, estimated costs involved, project team name etc.
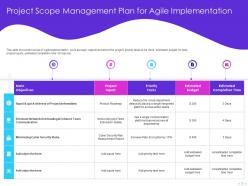
Slide 6: This slide shows the scope of Agile Implementation such as major objectives behind the project, priority tasks to be done, estimated budget for task, project inputs, estimated completion time for task etc.
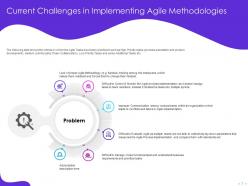
Slide 7: This slide shows the problems that are encountered by the team in implementing Agile Methodologies such as difficulty in monitoring, improper cross team communication, problems in evaluating Agile, lack of a proper Agile Method etc.
Slide 8: This slide shows the Agile Structure that includes the details of the team such as business owner, product owner, development team members, scrum master etc.
Slide 9: This slide shows Table of Contents.
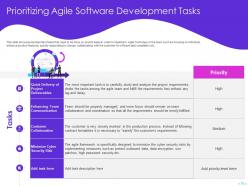
Slide 10: This slide shows some important tasks that need to be done on priority basis in order to implement Agile Technique in the team such as focusing on individual, enhance product features, quickly responding to change, collaborating with the customer for efficient task completion etc.
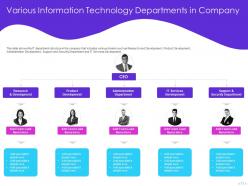
Slide 11: This slide shows the IT department structure in the company that includes various division such as Research and Development, Product Development, Administration Development, Support and Security Department and IT Services Development.
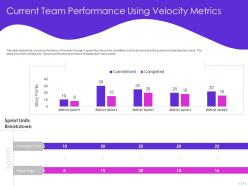
Slide 12: This slide depicts the current performance of the team through a graph that shows the committed work to be done and the actual work that has been done. The tasks have been divided into various sprints and performance is measured in story points.
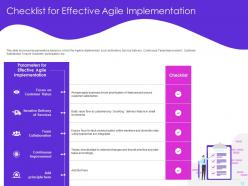
Slide 13: This slide shows some parameters based on which the Agile is implemented such as Iterative Service Delivery, Continuous Tasks Improvement, Customer Satisfaction, Ensure Customer participation etc.
Slide 14: This slide shows Table of Contents.
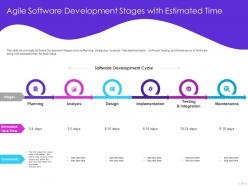
Slide 15: This slide shows Agile Software Development Stages such as Planning, Designing, Analysis, Task Implementation, Software Testing, and Maintenance of Software along with estimated time for each stage.
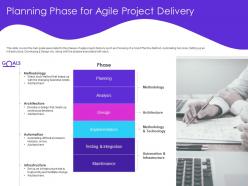
Slide 16: This slide covers the main goals associated to the phases of agile project delivery such as Choosing of a Cost-Effective Method, Automating Services, Setting up an Infrastructure, Developing a Design etc. along with the phases associated with each.
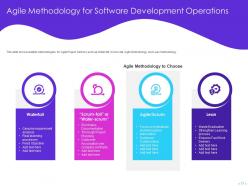
Slide 17: This slide shows multiple methodologies for Agile Project Delivery such as Waterfall, Scrum-fall, Agile Methodology and Lean Methodology
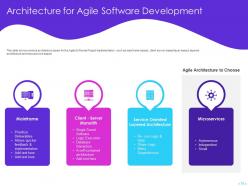
Slide 18: This slide shows various architecture types for the Agile Software Project Implementation such as mainframe based, client server-based layer based, layered architecture and microservice based.
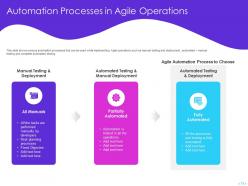
Slide 19: This slide shows various automation processes that can be used while implementing Agile operations such as manual testing and deployment, automated + manual testing and complete automated testing.
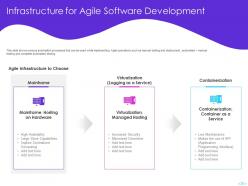
Slide 20: This slide shows various infrastructure type for the Agile Software Project Implementation such as mainframe, virtual/managed hosting or containerization.
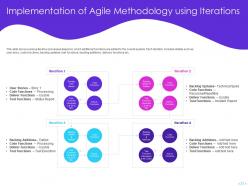
Slide 21: This slide shows various Iterative processes based on which additional functions are added to the overall system. Each Iteration includes details such as user story, code functions, backlog updates, test functions, backlog additions, delivery functions etc.
Slide 22: This slide displays Table of Contents.
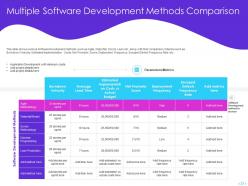
Slide 23: This slide shows various Software Development methods such as Agile, Waterfall, Scrum, Lean etc. along with their comparison criteria's such as Burndown Velocity, Estimated Implementation Costs, Net Promoter Score, Deployment Frequency, Escaped Defect Frequency Rate etc.
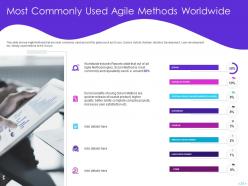
Slide 24: This slide shows Agile Methods that are most commonly used around the globe such as Scrum, Custom Hybrid, Kanban, Iterative Development, Lean development etc. Mostly used method is the Scrum.
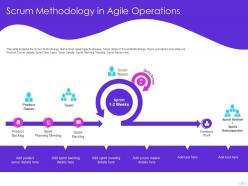
Slide 25: This slide explains the Scrum Methodology that is most used Agile Technique. Some detail of Scrum Methodology that is provided in this slide are Product Owner details, Sprint Time Span, Team Details, Sprint Planning Meeting, Sprint Review etc.
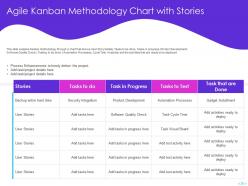
Slide 26: This slide explains Kanban Methodology through a chart that shows User Story Details, Tasks to be done, Tasks in progress (Product Development, Software Quality Check), Testing to be done ( Automation Processes, Cycle Time Analysis) and the activities that are ready to be deployed.
Slide 27: This slide displays Table of Contents.
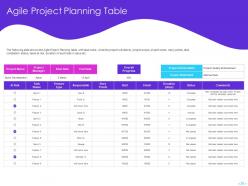
Slide 28: The following slide shows the Agile Project Planning table with task name, what the project will deliver, project scope, project name, story points, task completion status, tasks at risk, duration of each task in days etc.
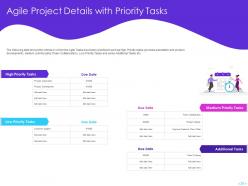
Slide 29: This slide shows the criteria on which the Agile Tasks have been prioritized such as High Priority tasks (process automation and product development), medium priority tasks (Team Collaboration), Low Priority Tasks and some Additional Tasks etc.
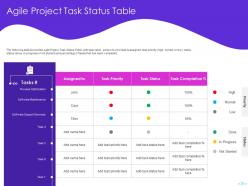
Slide 30: This slide shows the Agile Project Task Status Table with task name, person to who task is assigned, task priority (high, normal or low), tasks status (done, in-progress or not started) and percentage of tasks that has been completed.
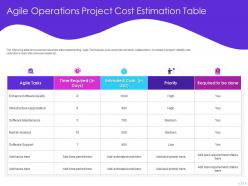
Slide 31: This slide shows estimated costs involved in Agile Implementation with agile tasks (Infrastructure Upgradation, Software Support, Market Analysis) , estimated time required, task priority level (high, medium or low) , task requirement criteria etc.
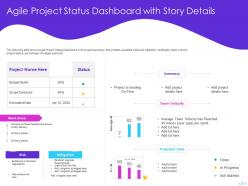
Slide 32: The following slide shows Agile Project Status Dashboard with project summary, story details, possible risks and mitigation strategies, team velocity, project status, percentage of budget spent etc.
Slide 33: This slide displays Table of Contents.
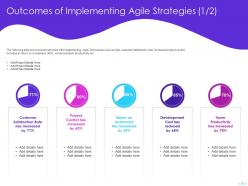
Slide 34: This slide highlights some outcomes after implementing Agile Techniques such as high customer satisfaction rate, increased project control, increase in return on investment (ROI), enhanced team productivity etc.
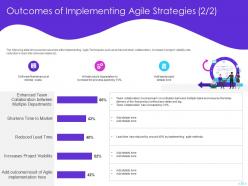
Slide 35: The following slide shows some outcomes after implementing Agile Techniques such as enhanced team collaboration, increase in project visibility rate, reduction in lead time between tasks etc.
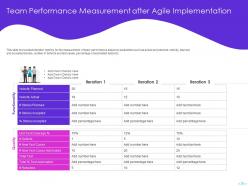
Slide 36: This slide shows team iteration metrics for the measurement of team performance based on parameters such as actual and planned velocity, planned and accepted stories, number of defects and test cases, percentage of automated tests etc.
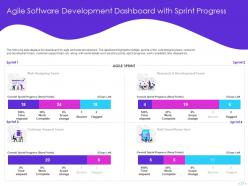
Slide 37: The following slide displays the dashboard for agile software development. The dashboard highlights multiple sprints of the web designing team, research and development team, customer support team etc. along with some details such as story points, sprint progress, work completed, time elapsed etc.
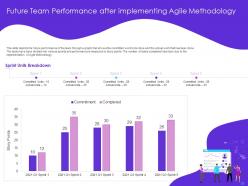
Slide 38: This slide depicts the future performance of the team through a graph that shows the committed work to be done and the actual work that has been done. The tasks have been divided into various sprints and performance is measured in story points. The number of tasks completed has risen due to the implementation of Agile Methodology.
Slide 39: This is Agile Operations for Optimizing Tasks and Enhancing Team Performance Icons Slide.
Slide 40: This slide is titled as Additional Slides for moving forward.
Slide 41: This slide shows Timeline process.
Slide 42: This slide shows Roadmap process.
Slide 43: This slide displays Our Target.
Slide 44: This slide is titled as Post it Notes. Post your important notes.
Slide 45: This is Venn slide.
Slide 46: This is Puzzle slide.
Slide 47: This is Thank You slide with Contact details.
Agile operations for optimizing tasks and enhancing team performance powerpoint presentation slides with all 47 slides:
Use our Agile Operations For Optimizing Tasks And Enhancing Team Performance Powerpoint Presentation Slides to effectively help you save your valuable time. They are readymade to fit into any presentation structure.


FAQs for Agile operations for optimizing tasks and enhancing team performance
Agile operations centers on iterative development, continuous improvement, and customer collaboration, encompassing principles like flexibility, rapid feedback loops, and self-organizing teams. Unlike traditional models that emphasize rigid planning and sequential execution, Agile operations prioritize adaptability and responsiveness to changing market demands, enabling organizations to deliver value incrementally and accelerate time-to-market. Many tech companies, for example, have successfully adopted Agile methodologies, finding increased efficiency and customer satisfaction through this iterative approach.
Agile operations enhance an organization's responsiveness to market changes by breaking down projects into smaller, iterative cycles, enabling faster feedback loops and adjustments. Through cross-functional collaboration, continuous improvement, and a focus on delivering value incrementally, organizations like tech startups and financial institutions can adapt to evolving customer needs and competitive pressures, ultimately accelerating time-to-market and boosting agility in dynamic environments.
Cross-functional collaboration is essential to Agile operations success as it brings together diverse perspectives, expertise, and insights from product owners, developers, testers, designers, and business stakeholders. These integrated teams break down silos, enabling faster decision-making, smoother workflow transitions, and more responsive adaptation to changing customer needs, ultimately leading to faster time-to-market and increased customer satisfaction.
Agile operations enhance customer satisfaction and engagement by prioritizing iterative development, continuous feedback loops, and rapid response to changing needs. Through sprints, daily stand-ups, and close collaboration with customers, organizations can quickly adapt to feedback, deliver value incrementally, and ensure that solutions truly meet evolving customer expectations. This iterative approach, often seen in industries like software development and retail, fosters a culture of responsiveness and customer-centricity, ultimately leading to increased loyalty and positive experiences.
Organizations tracking Agile operations effectiveness should monitor key metrics such as sprint velocity, cycle time, and lead time, which reveal development speed and efficiency. Additionally, tracking burn-down charts and user story completion rates provides insight into team performance and progress towards goals, ultimately demonstrating Agile's impact on project delivery and customer satisfaction.
Agile operations can be facilitated by technology and tools that streamline collaboration, communication, and workflow visibility. Platforms like project management software, communication tools, and automated testing systems enable teams to work iteratively, track progress transparently, and quickly adapt to changing requirements. Financial institutions, for example, leverage these technologies to accelerate loan processing, while retail organizations use them to optimize inventory management and customer service, ultimately leading to increased efficiency and responsiveness.
Transitioning to Agile operations presents both challenges and opportunities for organizations. Common hurdles include resistance to change from established teams, difficulty in adapting traditional project management structures, and the need for ongoing skill development in Agile methodologies. Overcoming these challenges can be achieved by fostering a culture of collaboration and transparency, providing comprehensive training and support for employees, and starting with pilot projects to demonstrate the value of Agile within specific departments. Ultimately, successful Agile implementation enables organizations to deliver value faster, adapt to changing market demands, and enhance overall customer satisfaction.
Agile operations contribute to a culture of continuous improvement by emphasizing iterative development, regular feedback loops, and collaborative problem-solving. Through short development cycles, teams can quickly adapt to changing requirements, identify areas for optimization, and implement solutions in a timely manner. This iterative process, coupled with transparent communication and shared responsibility, empowers teams to learn from each experience, refine processes, and ultimately deliver higher quality products and services.
Agile operations align with strategic business goals by emphasizing iterative development, customer feedback integration, and continuous improvement. This synergy enables organizations to adapt quickly to market changes, deliver value faster, and enhance customer experiences, ultimately leading to increased agility, operational efficiency, and competitive advantage.
Maintaining Agile operations in remote or hybrid work environments involves fostering collaboration, communication, and transparency. Best practices include leveraging virtual collaboration tools, establishing clear communication protocols, conducting regular online stand-up meetings, and prioritizing frequent feedback loops. Many organizations find that these strategies enhance productivity and team cohesion, even across geographical distances.
Agile operations foster innovation and creativity in product development by emphasizing iterative cycles, rapid feedback loops, and cross-functional collaboration. Through continuous testing and refinement, teams can quickly adapt to changing market demands, incorporate user feedback, and explore new ideas, ultimately delivering more innovative and customer-centric products. Many technology companies, particularly in the software sector, find that Agile methodologies significantly accelerate time-to-market while enhancing the quality and relevance of their offerings.
Agile operations involve iterative development cycles, close collaboration, and continuous improvement, leading to faster time-to-market and enhanced responsiveness. Financial services institutions, like banks, have successfully implemented Agile to streamline loan approval processes, while retail companies have leveraged it to optimize inventory management and personalize customer experiences. Many organizations across diverse sectors are finding that Agile operations enable them to adapt quickly to evolving market demands and deliver superior customer value.
Agile leadership involves fostering a culture of collaboration, transparency, and continuous improvement. Leaders can support Agile principles by empowering teams to self-organize, removing roadblocks, and promoting iterative development cycles. By embracing these practices, organizations can streamline workflows, enhance responsiveness to market changes, and ultimately deliver higher-quality products and services, with many tech companies finding increased efficiency and customer satisfaction through Agile adoption.
Agile operations significantly impacts supply chain management and logistics by fostering flexibility, responsiveness, and collaboration. Through iterative development cycles and continuous feedback loops, Agile enables organizations to adapt to changing market demands, optimize inventory levels, and streamline delivery processes, ultimately leading to faster time-to-market and improved customer satisfaction. Many manufacturing and retail companies are finding that Agile methodologies enhance their supply chain resilience, enabling them to navigate disruptions and uncertainties more effectively.
Successfully adopting Agile operations requires training that covers both the theoretical framework and practical application. Essential resources include Agile methodology courses, workshops on Scrum or Kanban frameworks, and access to online communities or mentorship programs. These resources equip teams with the knowledge to effectively plan sprints, manage backlogs, and foster continuous improvement, ultimately leading to increased efficiency, faster time-to-market, and enhanced customer satisfaction.
-
Attractive design and informative presentation.