


Annual report complete powerpoint deck with slides






Try Before you Buy Download Free Sample Product
 Impress Your
 Audience
 100%
100% Editable
 Save Hours
 of Time


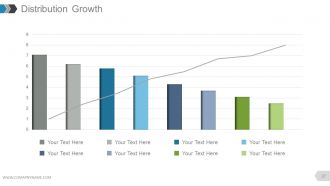
Presenting an annual report PowerPoint presentation just got better with our pre made PPT sample file. The only thing that is left now is to download our PowerPoint show and cast spotlight on your company’s activities, achievements, auditor’s report and annual accounts of previous year. Furthermore, our business annual report PPT model helps stakeholders and partners to comprehend the financial position, income statement, market outlook, objectives and future directions of a company. Best part here is our exclusive slide templates like company history and milestones, our heritage, global presence, achievements, sales highlights, distribution growth etc. are included to give a new dimension to promotions of a company. All in all, with support of our yearly report PPT presentation you can emphasize complete strategic plan of your company so as to put up a firm company image. In short, giving an arty touch to annual report of a company this presentation deck is the one you cannot afford to miss out. Go beyond client expectations with our Annual Report Complete Powerpoint Deck With Slides. They help deliver that extra bit.
People who downloaded this PowerPoint presentation also viewed the following :
Content of this Powerpoint Presentation
You must already know that annual reports are one of the best sources of information that offer insights related to your business's performance. Different businessmen and officials use the Annual Report to cater to different requirements. It can motivate investors to infuse funds into your business, inform government officials, and more
Annual reports are undoubtedly beneficial; however, managers and executives seem to have a hard time using them. The main reason is the degree of inclusiveness and complexity associated with these reports. Even experienced managers fail to create a well-versed and thorough annual report. And in the face of urgency, the matters may go south.
What’s the solution?
A pre-designed and highly inclusive report is the most optimal solution to such problems. SlideTeam's 100% customizable annual report PPT template can help you get the same. The template's content is quite extensive and covers all the crucial aspects, facts, and figures that an annual report should include. If you wish to learn more about the template's contents, keep reading this blog.
Check out our annual report summary template to present descriptive report.
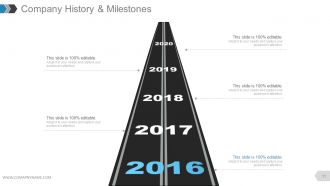
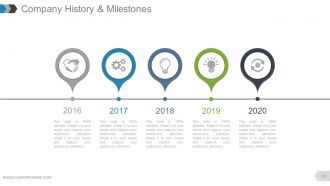
Template 1: Company History and Milestones
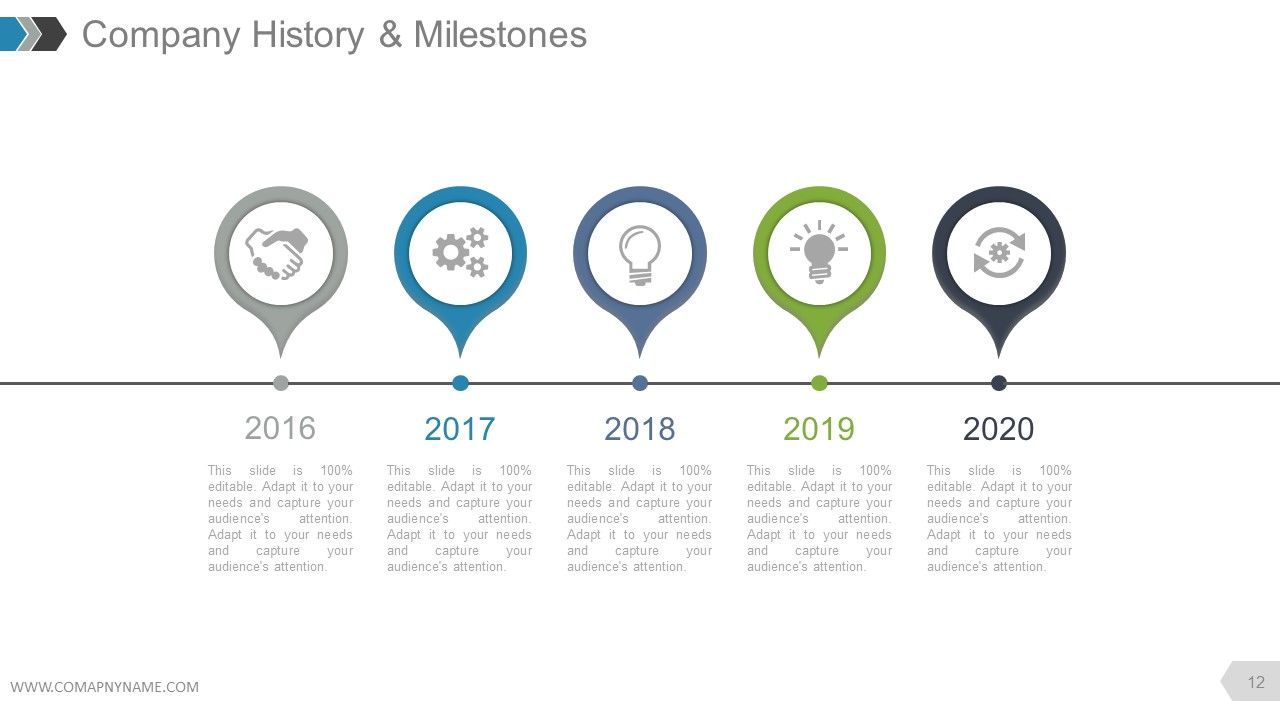
Enlighten your audience about your annual performance by sharing your business history and milestones. Use this PPT Template to include all the significant events in your business. These may include purchasing a new head office, merging with other companies, etc. You can add some text describing the event that occurred, in brief below, the year-wise progress of your company.
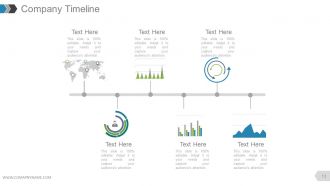
Template 2: Company Timeline
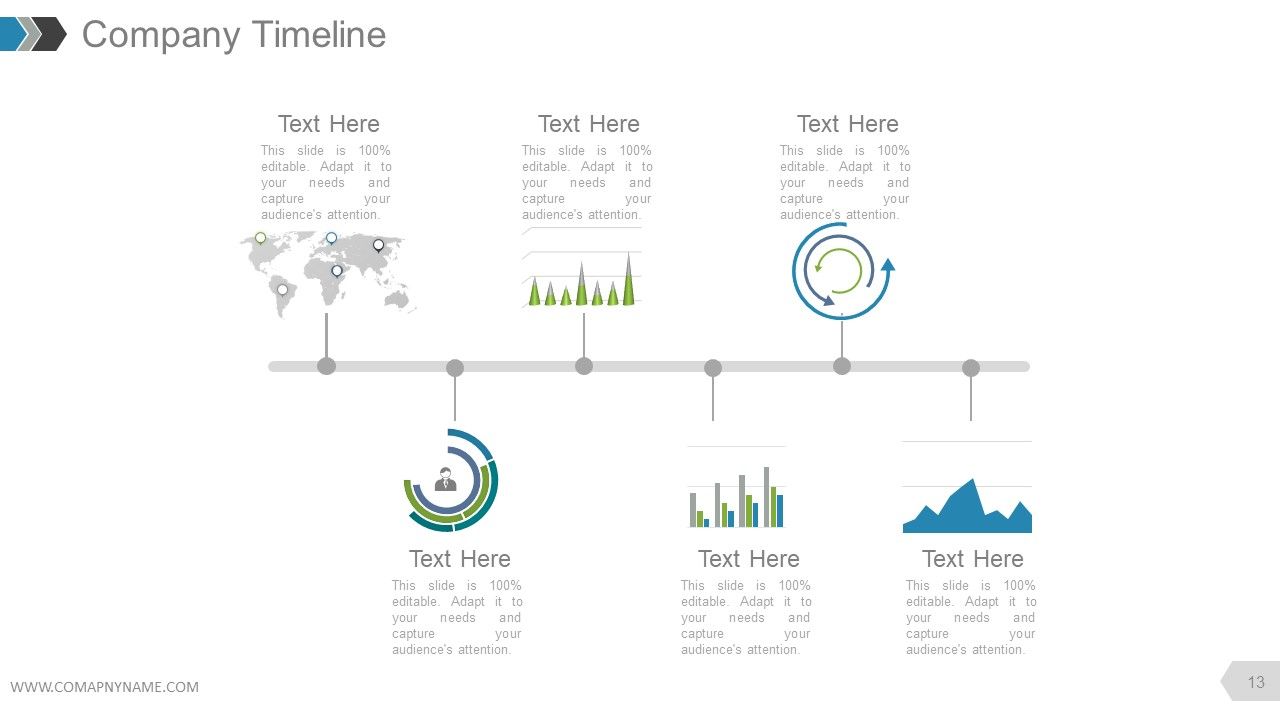
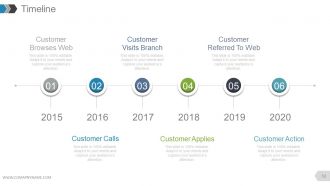
This company timeline slide lets you add more information about the business's proceedings. Using this slide, you can either bifurcate the events of each year or add some other information for any period as required. Adding supportive text will go a long way in turning the opinion of your audience positively.
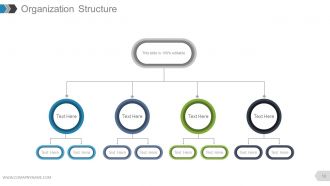
Template 3: Organization Structure
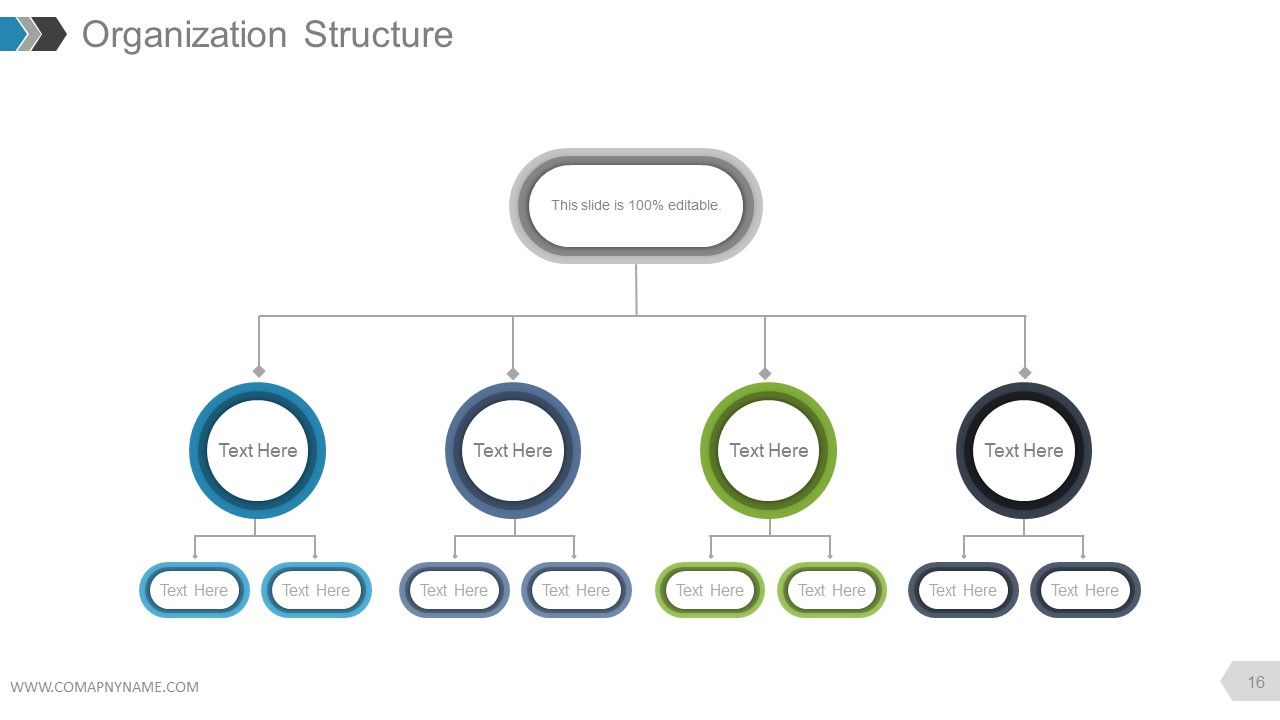
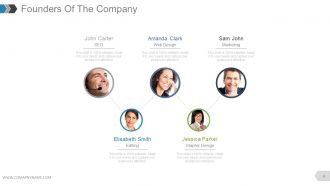
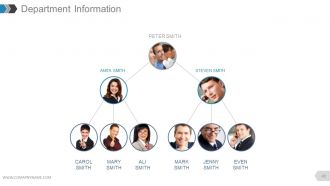
The top-level management of a company is the main decision-maker. Moreover, the popularity and experience of such managers can also be pivotal in grabbing the required attention of your audience. Hence, you can use this slide of the annual report template to showcase the organizational structure and managerial faces in the company. You can use the multi-tiered chart to showcase which executives work under whose supervision and department.
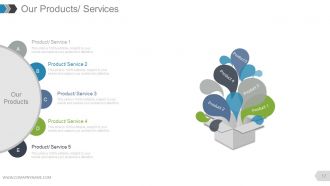
Template 4: Our Products/Services

Your annual report will include information on your business products and services. This slide allows you to represent all the important products and services you offer. This information will help you enlighten your audience about which product has brought your business to this level.
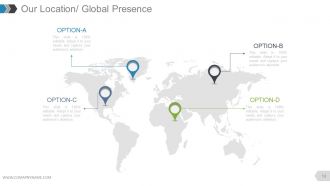
Template 5: Our Location/Global Presence

Use this PPT Template to showcase all your business locations on a global map. You can add subtext to the area to offer some details related to the performance of each business office. If your audience is international, showcasing these locations can help them make an informed decision.
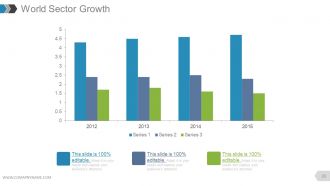
Template 6: World Sector Growth

This PPT Slide uses a multi-colored bar graph to showcase the growth rate. This will help the audience judge your company's performance relative to the world's. You can represent the growth rate of up to three series in four years. There's also a substantial space to add supportive text regarding the series you showcase.
Template 7: Achievements

It may be challenging for a business to enlighten others about its past achievements. This slide can help you showcase the business's top achievements. Remember, all the achievements that you include in this slide are the most crucial and pivotal. You should add such achievements that will help you grab the required attention. So, target what's essential. You can add up to four different achievements in this slide for ease.
Template 8: Financial Highlights
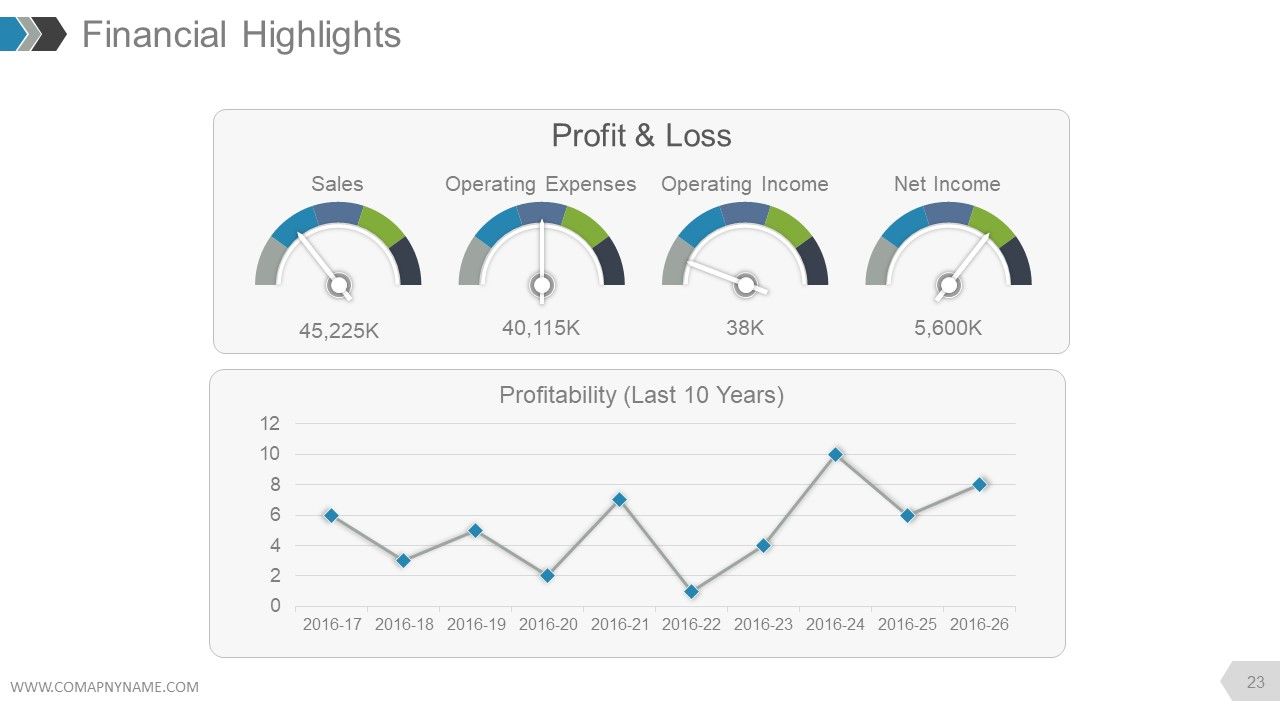
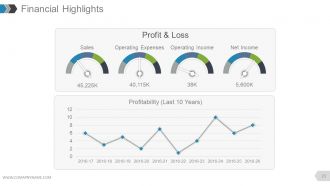
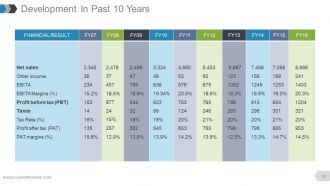
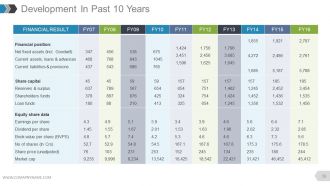
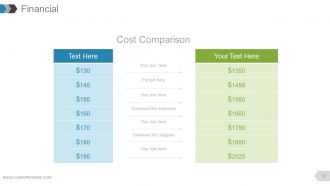
This PPT Layout helps showcase the business's financial highlights in two ways. You can discuss the profit and loss in the previous year and the profitability in the past ten years. Under the profit and loss section, you can showcase the annual sales, operating expenses, operating income, and net income.
Template 9: Financial Statement
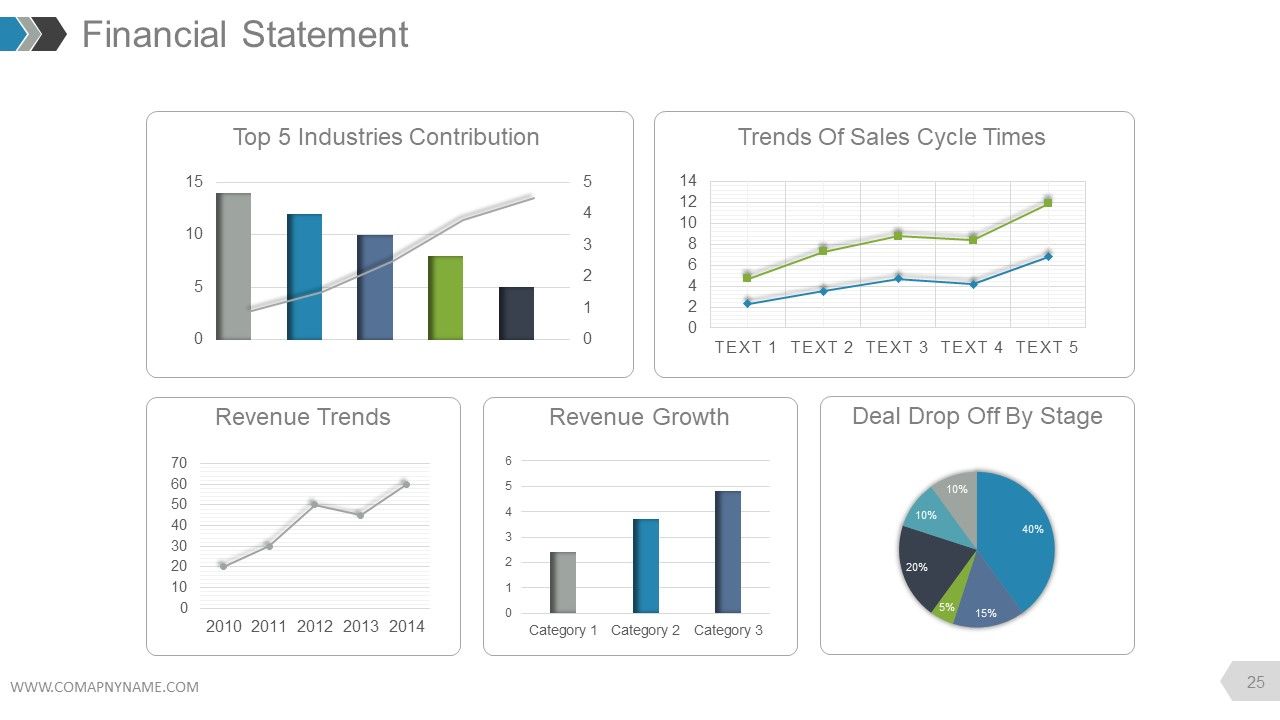
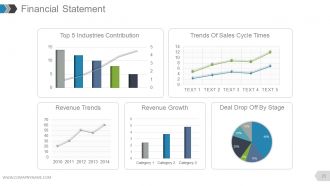
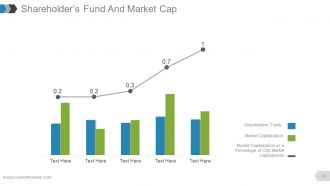
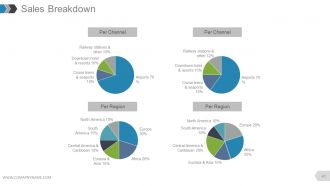
In this slide, you can represent the business's financial statements using bar graphs, pie charts, and more. Here, you can showcase the Top 5 Industries Contribution of the Business, the entire Trend of Sales Cycle Times, the Trend of Revenue in the past years, the Growth Rate of Revenue, and the Deal Drop Off by Stage percentage. This data offers further and deeper insights into your business and its activities.
Template 10: Sales Highlights

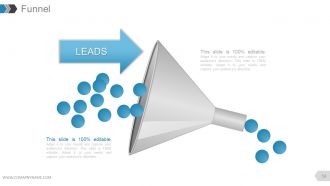
Sales of a business, if disclosed, can enlighten your audience about the soundness of your sales team, operational activities, and so many other elements. In the slide, you can showcase facts and data such as Total Sales for each month in the previous year, Opportunity Total Sales by Probability in percentages, Total Sales amount concerning the record count, and Lead Sources of Revenue Shares. This is the best slide to cater to your audience's questions in an easy-to-understand way.
Looking for a way to represent the annual report on the human resource segment of your business, then use this template.
Annual Report: Pivot your audience towards the goodness of your business
An annual report template is the most convenient and proven technique that has helped several businesses. Using the report, you can shed some light on the business's annual performance in previous years. Once the audience gets the gist about your business and its performance, you can achieve what you set out to achieve. Whether it's investments, sales, or anything else, use the smart annual report template and get things done.
To enlighten your audience about the performance of your HR department, check out this fully-inclusive template offered for your feasibility.
Annual report complete powerpoint deck with slides with all 60 slides:
Use our Annual Report Complete Powerpoint Deck With Slides to effectively help you save your valuable time. They are readymade to fit into any presentation structure.















FAQs for Annual report complete powerpoint
Okay so for your annual report deck - start with exec summary showing your biggest wins right up front. Then hit financial highlights like revenue and profit. Major accomplishments come next, plus where you stand in the market now. Charts and graphs over walls of text, trust me on this one. Most decks totally bomb because they throw every random metric at people instead of focusing on what actually matters to stakeholders. Oh and don't forget the forward strategy piece. The whole thing needs to flow together as one story - not just "here's what happened" but why it sets you up for what's coming next.
Dude, charts and graphs beat bullet points every time for showing trends. But here's the thing - infographics can actually connect your metrics to show cause and effect, which is pretty cool. I'm obsessed with timeline visuals (maybe too much?) because they help people follow your company's whole year. Real photos of employees or customers make those numbers feel human instead of just... numbers. Don't just slap visuals everywhere though. Try storyboarding first so you know where they'll actually make a difference. You want them supporting your story, not just looking pretty.
Pick your colors and fonts first - stick to 2-3 colors max and one main font. Seriously, I've watched so many presentations crash because someone went crazy with like 8 different colors. Just don't. Keep everything consistent - same spacing, logo in the same spot every time, matching chart styles. Oh, and make a master template before you start building slides. Trust me on this one, it'll save you hours of tweaking later. Use the same icon style throughout too. Simple stuff but it makes a huge difference in how professional it looks.
Make your charts tell a story instead of just throwing numbers at people. Line graphs work great for showing growth over time, bar charts are perfect for comparisons. Pie charts? Honestly skip them most of the time - they're so overdone. Keep colors simple and consistent with your brand. Here's the thing though - your chart titles should literally state the main point. Don't make people guess what they're looking at! Each visual needs to back up something specific you're saying. Oh, and definitely test your charts on someone fresh. They'll spot confusing stuff you totally missed.
Honestly, less is way more with these presentations. Your slides shouldn't look like a Wikipedia page - people's eyes just glaze over. Tell a story that connects everything instead of jumping around randomly. Nobody wants to watch you read bullet points out loud either (seriously, we can all read). Pick maybe 3-5 big wins and problems to focus on rather than trying to cover every tiny detail from accounting to HR. I always think the best presentations feel more like a conversation anyway. Make sure each section ends with actual next steps so people know what you're planning to do, not just what already happened.
Honestly, just make different versions of the same deck for each group. Investors want to see all the money stuff - growth numbers, ROI projections, that kind of thing. Board members care about governance and risk management. Employees? They want culture updates and what's coming next (they zone out during financial slides anyway lol). For customers, lead with innovation and how you're making their lives better. Same basic content, just shuffle the order and change what you emphasize. Start with a master version, then customize from there. Way easier than starting from scratch each time.
Definitely don't skip branding in your annual report - it's the difference between looking professional vs like you cobbled slides together last-minute. Stick to your company colors, fonts, and logo on every slide. I've seen so many decks that look like someone went crazy with random templates (yikes). Your brand guidelines should control everything - layouts, icons, even how charts look. Oh and create a master template first with all your brand stuff, then build from there. That visual consistency is what makes the whole thing feel polished instead of messy.
Dude, less text = better slides. Trust me on this one. I made the mistake of cramming way too much info on slides during a board meeting last year and watched everyone's eyes glaze over. Super awkward. One main point per slide, that's it. Charts and visuals work way better than bullet points anyway - people actually pay attention to those. If you absolutely need text, make it huge. Like, can-the-person-in-the-back-row-read-this huge. All your detailed stuff should go in your speaker notes, not on the actual slides. Your audience will thank you for it.
Honestly, start with Canva's annual report templates - they're surprisingly good and will save you hours. PowerPoint has some decent ones too if you poke around the "New" section. Beautiful.ai and Slidebean are worth the money though, especially since they auto-adjust layouts when you dump in all that financial stuff. Visme's cool for infographics if you need those. Oh, and whatever you do, don't switch templates halfway through like I did last year. Looked like a mess and I had to redo everything. Just pick one style and commit to it from the start.
Charts beat tables every time - way easier to read. I go with bar charts for comparing stuff, line graphs when I'm showing trends. Honestly, my first presentation was a disaster because I threw too much data at everyone. Now I always add percentage changes next to the raw numbers so people get it immediately. Don't pack everything onto one slide either. Same colors throughout helps too. The big thing though? Write quick bullet points explaining what your charts actually mean for business. Nobody wants to play detective with your numbers.
Dude, interactive stuff will totally save your annual report from being a snoozefest. Hyperlinked menus let people jump around to what they actually care about. Throw in some polls with Mentimeter or animated charts that build as you talk - way better than static slides. Video testimonials work great too, and I've seen people do this cool "choose your own adventure" thing where stakeholders can dig deeper into specific topics. Honestly, even just clickable navigation makes people pay attention. Don't go crazy though - start with maybe two interactive elements and see how it goes.
Start with your best numbers upfront - revenue growth, profit margins, cash flow. That's what they're looking for immediately. Market share and customer acquisition metrics are gold if they're solid. The debt-to-equity thing is super dry but you can't skip it unfortunately. For annual decks, year-over-year beats quarterly comparisons every time. Don't forget operational wins like cost cuts or efficiency gains - those actually matter more than people think. One metric per slide with clean visuals. Investors get cranky with messy charts. Hook them early with your strongest stuff.
Grab feedback right after each presentation - formal stuff AND those random hallway chats (honestly those are gold). Toss everything into a basic spreadsheet and watch for patterns. Like if everyone keeps saying "way too much text" or "where are the visuals?" - write that down. When you're prepping the next deck, actually look at your notes. Executive summary too wordy last time? Chop it. People wanted more industry data? Add it upfront this time. I swear, keeping a simple "worked/didn't work" list saves so much time. No point starting from scratch every year when you already know what lands.
Think of your deck like telling a story - start with whatever mess your company was dealing with this year, then show how you tackled it and what actually happened. Honestly, I picture it like making a mini-documentary or something. Each slide should build toward your main points, and don't just dump a bunch of data everywhere. Use charts and visuals that actually support what you're saying. Keep your language consistent so everything flows together. Oh, and end each section with a clear "so what does this mean" moment that sets up the next part of your story.
Loop in your legal team early - seriously, they'll save your ass later. Double-check that all your financial numbers match exactly what's in the annual report. No forward-looking stuff without disclaimers, I've watched people get completely wrecked by the SEC over this. Yeah, disclosures make slides ugly but include them anyway. Have legal review the ENTIRE deck, not just slides you think matter. Oh, and make yourself a checklist of industry requirements - trust me, you'll forget something obvious when you're scrambling at 2am before the presentation.
-
Great product with highly impressive and engaging designs.
-
Presentation Design is very nice, good work with the content as well.
-
Excellent Designs.
-
Qualitative and comprehensive slides.
-
The Designed Graphic are very professional and classic.
-
Best Representation of topics, really appreciable.
-
Awesome presentation, really professional and easy to edit.
-
Perfect template with attractive color combination.
-
Visually stunning presentation, love the content.
-
Excellent Designs.