


Annual report methodology powerpoint presentation slides





Try Before you Buy Download Free Sample Product
 Impress Your
 Audience
 100%
100% Editable
 Save Hours
 of Time


Download Annual Report Methodology PowerPoint Presentation Slides to present an impressive report on your activities and performance over the last year. Enlighten shareholders, internal staff or the external audience about what the company achieved, new activities undertaken, new products or services launched, corporate social responsibilities fulfilled, and the company’s financial performance with our Annual Report templates. An annual report ppt presentation follows a specified format. Our team of business researchers have done the content research and our professional PowerPoint designers have turned it into an impressive presentation with annual report layouts, images, data-driven graphs and charts. The annual report methodology begins with presentation agenda followed by a brief company introduction so that the new audience is aware about the business. The deck also covers PowerPoint templates on CEO's message, company vision, mission, company's historical background and key achievements. Present your products and services and financial highlights of the last year through this Annual Report. If your audience is shareholders, present detailed financial statements with our ready-to-use presentation diagrams on sales highlights, distribution growth, EBITDA highlights, profit after tax, book value per share, new fixed asset turnover, dividend per share, earnings per share, shareholders’ fund and market cap, inflation rate, and sales breakdown. Why spend hours designing annual report presentation when you can download this ready-made Annual Report template, add content and present with clarity!
People who downloaded this PowerPoint presentation also viewed the following :
Content of this Powerpoint Presentation
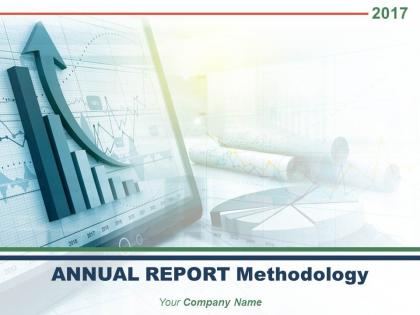
Slide 1: This slide introduces ANNUAL REPORT Methodology. State your company name here.
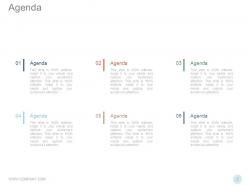
Slide 2: This is an Agenda slide with text boxes. State your agendas here.
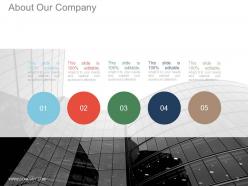
Slide 3: This is About Our Company slide to present company information, specifications etc.
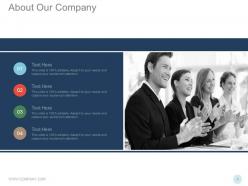
Slide 4: This is also About Our Company slide with image and text boxes.
Slide 5: This slide showcases Founders Of The Company with name and designation to fill.
Slide 6: This slide showcases CEO’s Message. Present quote or anything you beleive in here.
Slide 7: This is also a CEO’s Message slide. Present quote or anything you beleive in here.
Slide 8: This is titled VIsion Of The Company. Present company vision, mission etc. here.
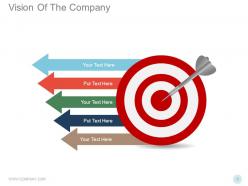
Slide 9: This slide also states the Vision Of The Company with target and arrow imagery.
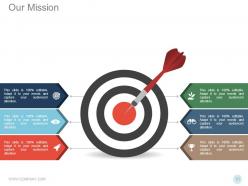
Slide 10: This is Our Mission slide. Use it to show company mission, goals etc.
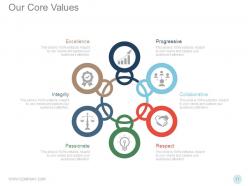
Slide 11: This slide states Our Core Values in a circular image form and icon imagery to go with.
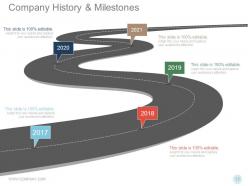
Slide 12: This slide presents Company History & Milestones in a roadmap form.
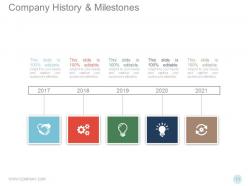
Slide 13: This is another slide stating Company History & Milestones in a timeline.
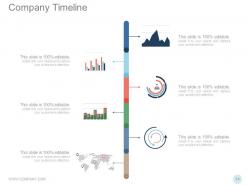
Slide 14: This slide showcases Company Timeline to state its milestones, evolution etc.
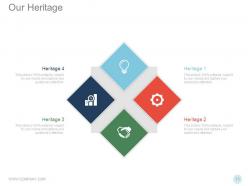
Slide 15: This is Our Heritage slide with icons and text boxes to fill.
Slide 16: This slide also shows Our Heritage with imagery and text boxes.
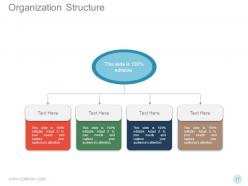
Slide 17: This slide showcases Organization Structure in a flow chart form. Use it to show the hierarchy of your comapany.
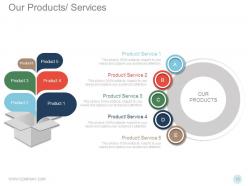
Slide 18: This slide states Our Products in a circular form with text boxes. Add your company products and services here.
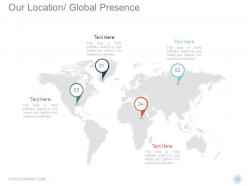
Slide 19: This is Our Location/ Global Presence slide on a world map image.
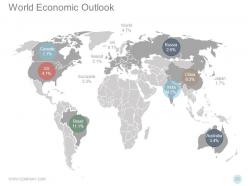
Slide 20: This slide presents World Economic Outlook on a world map image.
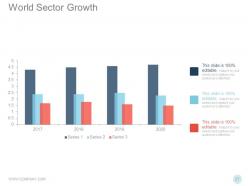
Slide 21: This slide showcases World Sector Growth in a bar graph/ chart form.
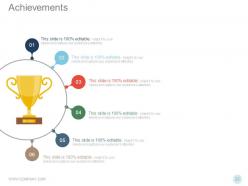
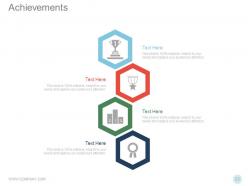
Slide 22: This slide shows company Achievements. You can add your own as per need.
Slide 23: This slide also states various Achievements of the company. Use it on the basis of your requirement.
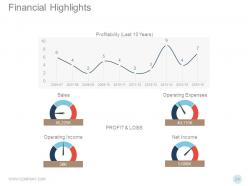
Slide 24: This slide states Financial Highlights in charts and graphs.
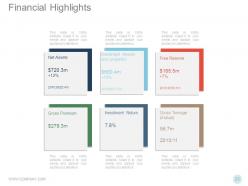
Slide 25: This slide also showcases Financial Highlights of the company.
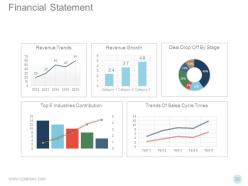
Slide 26: This slide presents company Financial Statement in charts and graphs.
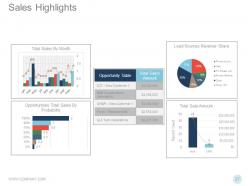
Slide 27: This slide presents Sales Highlights in charts and graphs. Use it to show your company sales.
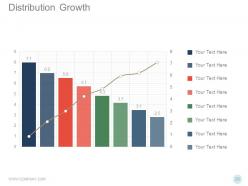
Slide 28: This slide showcases Distribution Growth in a combo chart/ graph form.
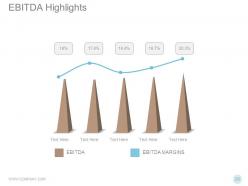
Slide 29: This slide presents EBITDA Highlights.
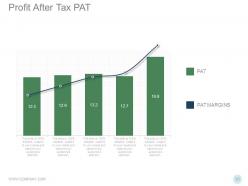
Slide 30: This slide showcases Profit After Tax PAT in a bar graph/ chart form.
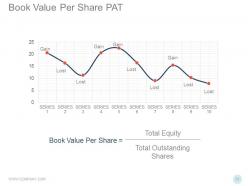
Slide 31: This slide shows Book Value Per Share PAT in a line chart/ graph.
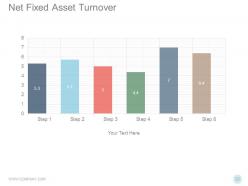
Slide 32: This slide displays Net Fixed Asset Turnover in a bar graph/ chart form.
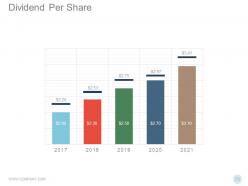
Slide 33: This slide shows Dividend Per Share in a bar chart/ graph.
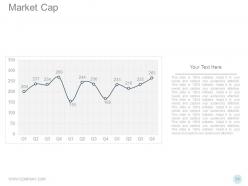
Slide 34: This slide showcases Market Cap in a line chart/ graph with text boxes. Use it to show your own company stats here.
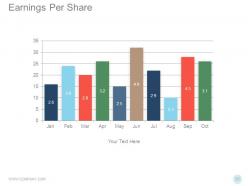
Slide 35: This slide shows Earnings Per Share in a bar chart/ graph form.
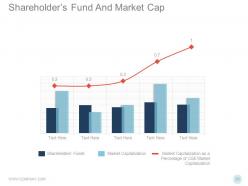
Slide 36: This slide showcases Shareholder’s Fund And Market Cap in a combo chart/ graph form.
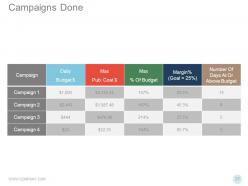
Slide 37: This is Campaigns Done slide. Use it to show your business campaigns etc.
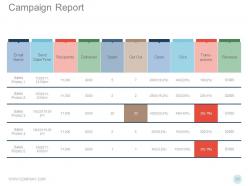
Slide 38: This slide presents the Campaign Report.
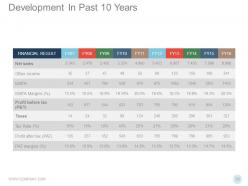
Slide 39: This slide showcases Development In Past 10 Years. Use it to show your own company developements.
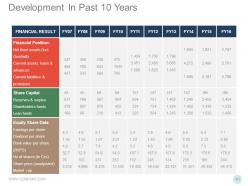
Slide 40: This slide also shows Development In Past 10 Years of the company.
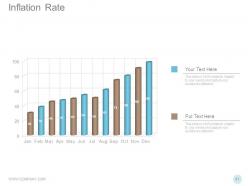
Slide 41: This slide showcases Inflation Rate in a bar graph/ chart form.
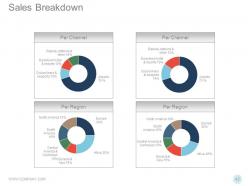
Slide 42: This slide shows Sales Breakdown in a pie chart/ graph form.
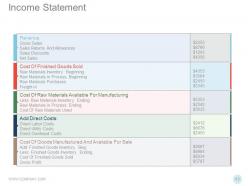
Slide 43: This slide shows Income Statement of the company.
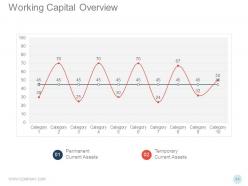
Slide 44: This slide presents Working Capital Overview in charts and graphs.
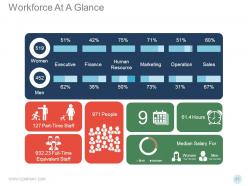
Slide 45: This is Workforce At A Glance slide.
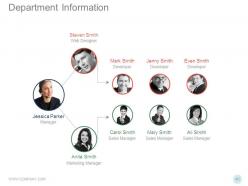
Slide 46: This slide presents Department Information with name, designation etc.
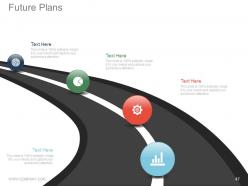
Slide 47: This slide states company Future Plans in a roadmap form.
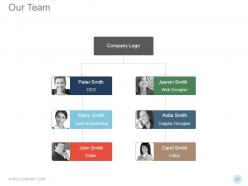
Slide 48: This is Our Team slide. Present team related information, specifications etc. here.
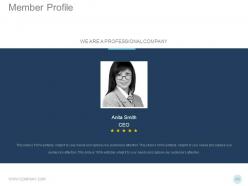
Slide 49: This is Member Profile slide with name and designation to state.
Slide 50: This slide is titled Additional slides for moving forward. You can change/ alter the content as per need.
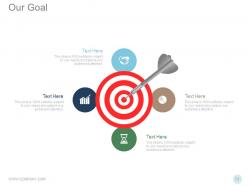
Slide 51: This is an Our Goal slide. State your important goals here.
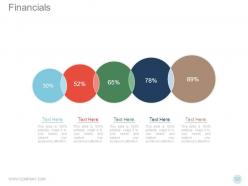
Slide 52: This slide is titled as Financials. Show finance related stuff here.
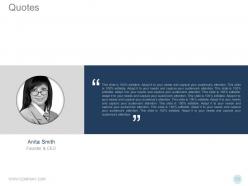
Slide 53: This is a Business Quotes slide to convey company's message, beliefs etc.
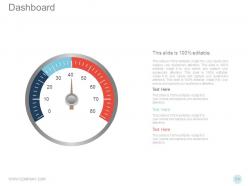
Slide 54: This is a Dashboard slide to state metrics, kpis etc.
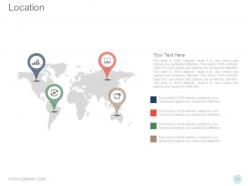
Slide 55: This is a Location slide of world map image to show global presence, growth etc.
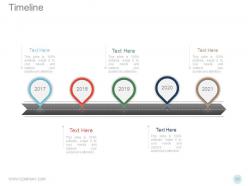
Slide 56: This is a Timeline slide to show evolution, growth, milestones etc.
Slide 57: This is a Bulb Or Idea image slide to show information, innovative aspects etc.
Slide 58: This is a Magnifying glass image slide to show information, scoping aspects etc.
Slide 59: This is a Funnel image slide to show funneling aspects etc.
Slide 60: This is Thank You slide stating Address# street number, city, state, Contact Numbers, Email Address.
Annual report methodology powerpoint presentation slides with all 60 slides:
Create better citizens with our Annual Report Methodology Powerpoint Presentation Slides. Educate them on their civic duties.






FAQs for Annual report methodology
**INPUT**: What key elements should be included in an annual report to effectively communicate company performance? **OUTPUT**: Key elements include financial statements, management discussion and analysis, operational highlights, strategic objectives, and governance information. These components work together by providing comprehensive transparency, demonstrating accountability to stakeholders, and showcasing strategic progress, with many investors and regulatory bodies finding that well-structured reports enhance credibility and stakeholder confidence. --- **Word count: 54 words**
Visual design enhances financial data understanding by transforming complex numbers into accessible charts, graphs, infographics, and data visualizations that highlight key trends and performance metrics. Through strategic use of color coding, comparative layouts, and interactive elements, organizations streamline stakeholder comprehension while reducing analysis time, ultimately delivering clearer insights and stronger investor confidence in an increasingly data-driven business environment.
Methodologies for ensuring accuracy include internal controls, independent audits, management reviews, segregation of duties, and reconciliation processes. These approaches streamline financial reporting by minimizing errors, enhancing transparency, and ensuring regulatory compliance, with many organizations finding that robust verification systems ultimately deliver greater stakeholder confidence and competitive advantage.
Industries tailor annual reporting methodologies by adapting disclosure frameworks, emphasizing sector-specific metrics, incorporating relevant compliance standards, and prioritizing stakeholder-focused narratives. Financial services emphasize risk management and regulatory capital, while manufacturing highlights sustainability metrics and operational efficiency, with healthcare focusing on patient outcomes and research developments, ultimately delivering transparency that enhances investor confidence and stakeholder engagement.
Stakeholder feedback significantly influences annual report content by identifying key information priorities, preferred communication styles, and critical performance metrics that different audiences value most. Through surveys, focus groups, and direct consultations, companies refine their reporting structure, enhance transparency around material issues, and ensure reports address investor, customer, and regulatory concerns, ultimately delivering more targeted and valuable communications.
Organizations integrate sustainability reporting into annual report methodology by embedding ESG metrics throughout financial sections, creating dedicated sustainability chapters with quantified environmental and social impacts, and aligning reporting frameworks like GRI or SASB with traditional financial reporting standards. This strategic combination enhances stakeholder transparency, meets increasing regulatory requirements, and demonstrates long-term value creation, with many companies finding that integrated reporting strengthens investor confidence while showcasing competitive advantages in sustainability leadership.
Non-financial metrics demonstrate organizational impact beyond profits, including employee satisfaction, environmental sustainability, customer retention, innovation indices, and social responsibility measures. These metrics should be reported through standardized frameworks like GRI or SASB, with clear methodologies, benchmarking against industry peers, and visual storytelling that connects non-financial performance to long-term business value and stakeholder trust.
Technology enhances annual reporting through automated data extraction, real-time analytics platforms, cloud-based collaboration tools, and AI-driven validation systems. These solutions streamline processes by eliminating manual data entry, reducing errors, and enabling faster consolidation across multiple departments, with many organizations finding that automated workflows deliver significantly improved accuracy and faster reporting cycles.
Best practices for regulatory compliance include adhering to accounting standards like GAAP or IFRS, implementing robust internal controls, ensuring accurate financial disclosures, maintaining comprehensive documentation, and conducting thorough independent audits. These frameworks streamline reporting processes by standardizing data collection, enhancing transparency, and minimizing compliance risks, with many organizations finding that systematic approaches ultimately deliver regulatory confidence and stakeholder trust.
Data visualization tools enhance annual reports by transforming complex financial data into interactive charts, infographics, dashboards, heat maps, and trend graphs that improve stakeholder comprehension. These technologies streamline investor communications by highlighting key performance indicators, revenue patterns, and market comparisons, with many organizations finding that visual presentations significantly increase engagement rates and deliver clearer strategic narratives to shareholders.
Companies should reassess their annual report methodology every 2-3 years, or when significant regulatory changes, stakeholder expectations, or business model shifts occur. This strategic review cycle enables organizations to enhance transparency, streamline reporting processes, and maintain competitive advantage, with many corporations finding that regular methodology updates ultimately deliver improved investor relations and operational efficiency.
Qualitative data challenges include inconsistent stakeholder feedback, subjective interpretation difficulties, time-intensive collection processes, and ensuring representative sample sizes across diverse organizational levels. Organizations overcome these through structured interview protocols, standardized survey frameworks, and dedicated data collection teams, while implementing cross-verification methods and digital platforms that streamline feedback aggregation, ultimately delivering more comprehensive and credible annual reporting.
Companies effectively communicate their strategic vision by integrating clear roadmaps, quantifiable goals, market positioning statements, and risk assessments throughout their annual report. Through compelling executive summaries and dedicated strategy sections, organizations articulate growth trajectories, competitive advantages, and stakeholder value propositions, while maintaining transparency about challenges, ultimately delivering investor confidence and strategic clarity.
Emerging trends in annual report methodologies include integrated reporting frameworks, ESG-focused storytelling, interactive digital formats, data visualization enhancement, and stakeholder-centric communication strategies. These approaches streamline transparency by combining financial performance with sustainability metrics, social impact narratives, and forward-looking strategic insights, with many organizations finding that comprehensive methodology adoption delivers enhanced investor confidence and competitive positioning.
Global reporting standards significantly impact annual report structure by mandating specific disclosure requirements, standardized financial metrics, sustainability reporting frameworks, and consistent presentation formats across jurisdictions. These standards, including IFRS, GRI, and SASB guidelines, enable organizations to enhance transparency, comparability, and stakeholder confidence while streamlining cross-border compliance, ultimately delivering improved investor relations and competitive advantage in increasingly regulated markets.
-
Use of different colors is good. It's simple and attractive.
-
Excellent Designs.