





 0 Comment
 Customer Reviews

Governance is essential to an organization's integrity: it determines how decisions are made, how risks are overseen, and how accountability is ensured. Governance is fundamentally about having transparency into all critical processes and metrics—created by oversight and allowing leaders to make decisions in a timely and confident manner. However, with so many data points and pitfalls lurking behind every layer of complexity, transparency can be hard to achieve without the tools to help avoid pitfalls.
Refer to our blog on Top 10 Governance Report Templates that aids in avoiding the occurrence of issues and keeps businesses on track.
Here governance dashboards are critical turning isolated data into a single story to track and monitor risks, compliance, and strategic oversight. But too many organizations struggle with implementing these dashboards. They face the challenge of collecting, measuring, accurately capturing, and ultimately relaying that data, in a way that stakeholders can understand.
Most leaders struggle to find the right levels of detail and clarity; governance reports are often too long/boring/detailed or inadequate rather than informative.
That’s where SlideTeam’s Top 10 Governance Dashboard Templates come in to help solve problems like these. Providing you with comprehensive dashboards covering critical governance frontiers such as compliance dashboards, regulatory dashboards, board reporting dashboards, internal controls dashboards, our templates is what all you need.
These templates are fully editable and friendly content to help you tell your story the way you want, specifically for your audience.
In addition to this, our dashboards are easy to export in PNG and JPG formats, fully editable and content and user - friendly, allowing you to present governance data with confidence and ease.
So, what makes you lag behind? Visit our blog to read and learn what is included, and how they can help you deliver governance reporting that matters.
Get an insight to our blog on Top 10 Management Dashboard Templates for safety officers and risk managers, for fostering a safer work environment.
Template 1: Governance Report Powerpoint PPT Template Bundles
This presentation slide gives a holistic preliminary view of the corporate governance monitor of major sectors. It covers company performance, project portfolios, and board member terms. It outlines board demographics, who each stakeholder is and the types and structures of meetings to promote transparency in leadership. Further, covers risk assessment to know the risks. It offers structured insights for visibility into the decision with clarity of governance compliance. Download it now.
[product_image id=697473]
Template 2: Smart Governance Dashboard for Data Visualization PPT Example
This PPT Theme showcase complex governance data covering criminal investigations by discipline and top violations. It transforms raw data into useful intelligence that drives decisions and this is what this dashboard supports you to do. This slide is beneficial for governance teams, compliance officers, and organizational executive leaders who need a quick view on organizational accountability and control and compliance monitor. Get it now for early detection of trends and/or problem areas.

Template 3: Dashboard for Effective Project Governance PPT Template
This PowerPoint Theme provides a data-backed dashboard on project performance. It provides a project manager with timely information on revenue, project cost performance and project progress. It provides a hub for tracking critical metrics to enable instant monitoring and immediate decision making. This governance performance tracker is particularly handy in spotting bottlenecks early on, tracking liquidity, and ensuring the project objectives are attuned. Claim it now.

Template 4: Dashboard for Tracking Project Status and Governance Effectiveness PPT Template
This PPT Theme includes key performance indicators, milestones, risk management panel, and resource distribution such that the manager is able to identify whether objectives are met on time and within other specified parameters. By offering necessary information, it allows you to see where delays might be coming from, as well as risks that you may otherwise be unaware of until they become serious problems. Download it now.

Template 5: Accounting Big Data Governance Dashboard PPT Template
This PowerPoint Slide integrates key accounting metrics like accounts receivable, accounts payable and net profit. It provides comprehensive insights into financial performance. Using a big data governance framework to assure accuracy, consistency, and security of accounting data across departments, it acts as a bird-eye view of a company's accounting information. It empowers finance teams to track cash flow and make informed decisions. Get it now.

Template 6: Public Governance Risk Rating and Analysis Software Dashboard PPT Template
This presentation template offers the overview of risk analysis done, risk assessment matrix, risk rating systems to help identify potential threats. It also provides action plans, so clarity to mitigation steps taken by governing bodies. This governance analytics provides a report of risks and security breaches allowing public administrators to evaluate adequacy of current safeguards. Claim it now to preserve the integrity of public initiatives.

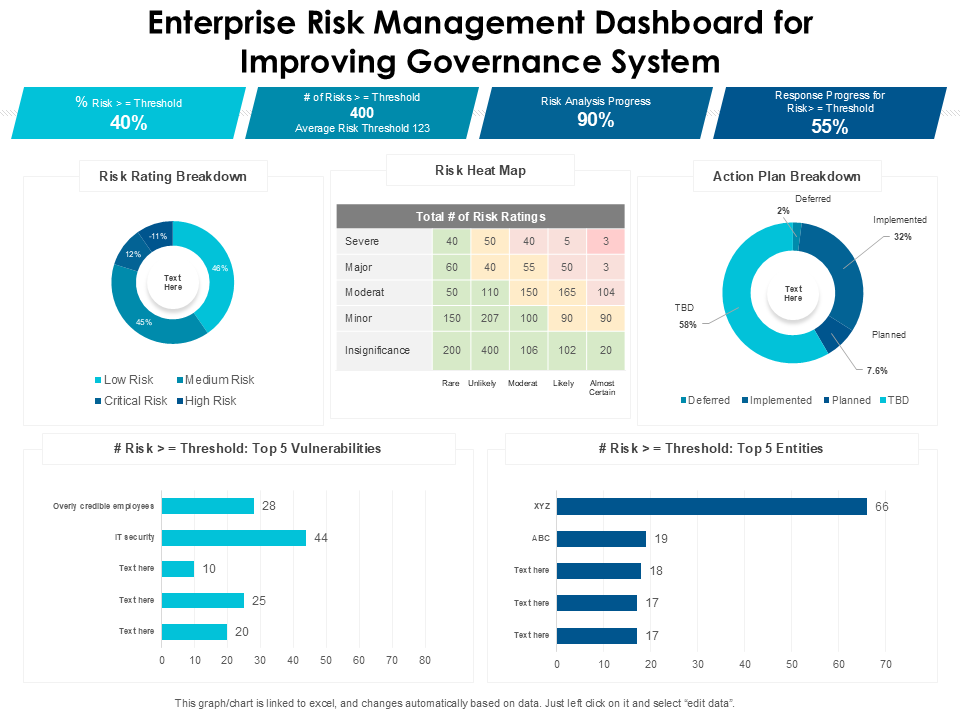
Template 7: Enterprise Risk Management Dashboard for Improving Governance System PPT Template
This PPT Theme covers key risk drivers across a company. Includes components such as a risk heat map, risk rating distribution, action plan overview, and the top 5 vulnerabilities. This ethics and compliance panel enables clear identification of high-risk areas to be addressed, and supports the governance system with data to assess, prioritize, and implement mitigation strategies. Download it now to have better control at enterprise level risk.
Template 8: KPI Dashboard to Measure Effectiveness of Data Ownership and Governance PPT Template
This PPT Template covers the audit dashboard to measure effectiveness of governance. It covers average time to complete work, maturity by attributes, open task by status, etc. These aspects aid in evaluating the effectiveness of data-related operations across teams. It also lists the total number of items and tracks changes by type for accountability making it easier to see the progress made. Download it now to fortify your data.

Template 9: Environmental Social Governance Dashboard With Organisational Alignment PPT Template
This PPT Slide provides an aggregate view of ESG across critical business dimensions. It covers financial KPIs, average net savings, policy and disclosure metrics and stakeholder engagement insights. This oversight dashboard assists leadership teams in matching ESG strategies against the corporations overall goals and values. Businesses can measure both impact and efficiency by monitoring things like net saving and alignment. Download it now for a responsible governance framework.

Template 10: Building Responsible Organization Corporate Governance Impact Assessment Dashboard PPT Template
This presentation slide shares core metrics like data quality as well as number of communities supported and so on. It also covers women, girls, children and youth. It assists organizations to keep an eye on their efforts in social responsibility and good strategic governance monitor practices. This dashboard provides real-time insights that helps organizations determine whether corporate strategy is driving inclusivity, transparency, and sustainability.. Get it now.

Govern with Clarity. Present with Confidence!
Governance dashboards have emerged as critical business tools for organizations across sectors, in a time when accountability, compliance and transparency are essential, never optional. These dashboards provide organizational performance, transparency dashboard, risk, and policy compliance tracker in one place so that leaders stay aware and aligned–from corporate boardrooms to nonprofit committees, IT governance teams, and ESG monitoring units.
The Top 10 Governance Dashboard Templates aid organizations to maintain ethical standards, manage regulatory compliance and foster stakeholder trust. Our governance metrics dashboards de-complexify cumbersome governance structures, flag red flags at the speed of light, and finally give you a way to measure, and therefore, progress against governance objectives.
So, why waste hours designing the dashboards from scratch? Download our templates for compliance, performance, and accountability with real action.
PS: Look out our blog on Top 10 Corporate Dashboard Templates tailored to your organizational processes.
Governance Dashboard FAQs
1. What key governance metrics are tracked in the dashboard?
Some of the key governance metrics that are tracked in the dashboard are:
Compliance Rate: Percentage of compliance with regulations on time
Policy Compliance: The extent to which one follows internal governance policies and standards
Audit Findings: Number of internal/external audits and related issues
Risk Register Snapshot: Identification of risks, mitigation steps and impact
Board meeting attendance & decisions: Frequency of meetings, list of attendees & action items from governance-related meetings
Ethics training completion rates: Mandatory staff completion rates
Such metrics serve to keep organizations transparent, accountable, and in-line with relevant regulations.
2. How are governance KPIs linked to strategic objectives?
By showing how decisions, risk management, and regulatory compliance add to achieving long term goals, Governance KPIs are closely aligned with an organization’s strategic objectives. For example:
Risk mitigation KPIs act in service of contract strategic continuity and continuity of ops in order to prevent and mitigate risk.
By supporting brand reputation, which is essential for market access and maintaining confidence in investors, metrics on compliance and ethics are also indirectly helping businesses to be more marketable.
The metrics for policy implementation ensure that the strategic change occurs uniformly, and employees embrace these changes to their daily activities across departments.
Linking KPIs to strategic objectives enables organizations to measure the performance of governance frameworks that govern responsible growth and performance.
3. What trends are visible in regulatory compliance over time?
Over time, dashboard might show trends on regulatory compliance, including:
Higher compliance rates due to better awareness and training
Audit problems that suggest systemic difficulties or gaps in policy
Fewer penalties or violations after policy changes or process improvements
Focus areas changing with regulations or the industry standard
Operational responsiveness as measured by time to resolution of compliance issues
Such trends lead to understanding the impact of governance practices and prioritizing them for improvement.


