

 0 Comment
 Customer Reviews

“A policy without tracking is just wishful thinking. A dashboard turns that wish into action.”
Welcome to the latest frontier of policy-making—where policies are not only recorded, but also visually monitored and continuously refined in real-time. In a world where data is abundant, the smarter organizations are adopting policy dashboards to manage and excel.
These dashboards aid in monitoring strategic policy formulation by providing an overarching view. Policy dashboards allow for measuring outcomes based on set anticipations to ensure maximum accuracy. The dashboards assist in tracking patterns, distribution of resources, and policy-driven leadership alignment objectives.
Let's not sugarcoat it. Creating a functional and elucidating dashboard from scratch is quite a hustle.
This is precisely why SlideTeam’s editable Policy Dashboard Templates with Examples are the products of the decade. They come pre-structured, making it easy while providing clarity alongside the functionality they desperately need.
Not only do we provide you dashboards, but SlideTeam also aids in providing decision support—which is far too important. With real-time data updates, monitoring of organizational or project domains turns effortless, leading to better responses to emerging risks or opportunities. Decision support systems help leverage insights, paving the way to more confidence in faster decision-making based on accurate, real information, not on conjecture.
These PPT Templates work best with your analytics dashboard setup, be it insurance, governance, HR, or any policy-driven sector. Thus organizations can leverage the underlying potential of business intelligence by integrating visuals that are oriented toward strategy.
Template 1: Social Media Policy Dashboard For Engagement Performance Template
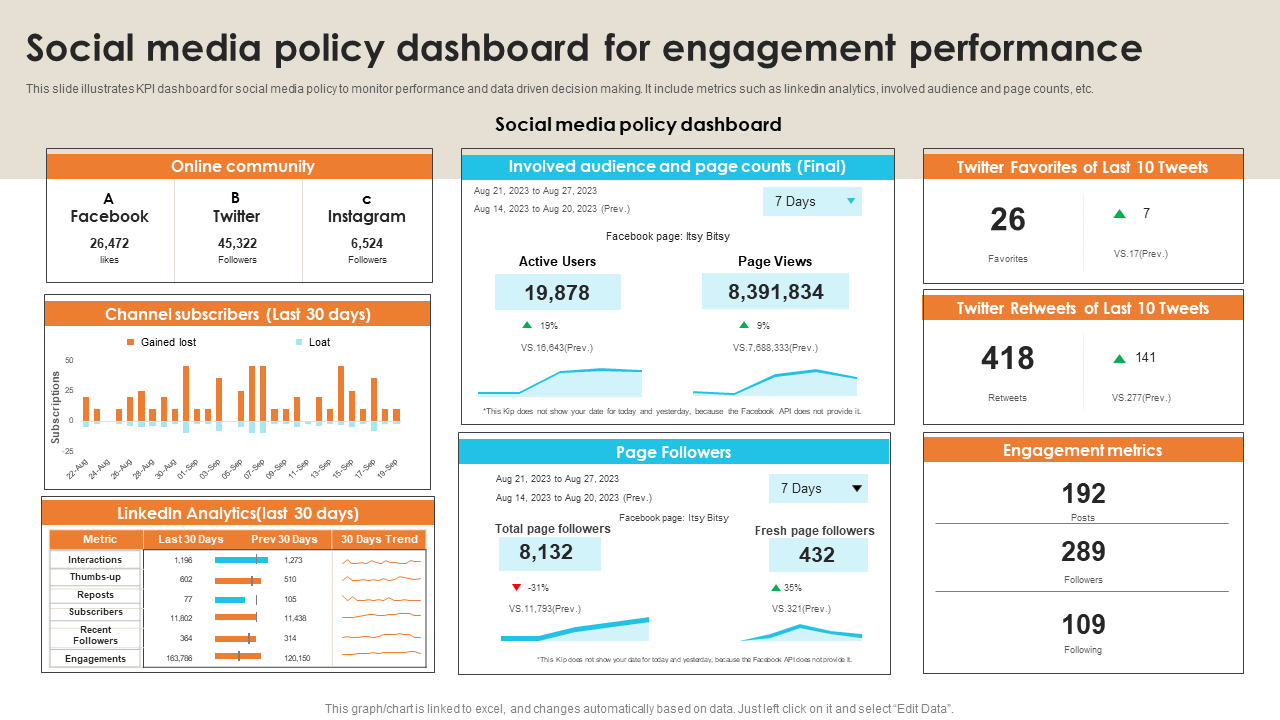
Policy management can be accomplished with this presentation template, which provides a comprehensive and systematic approach to assessing social media activities. The dashboard’s data visualization capability transforms complicated engagement metrics into measurable and practical steps that can be acted upon.
With numerous performance metrics, the dashboard enables the communication and PR teams to utilize the data scientifically.
The inclusion of a channel subscriber tracker and analytics for LinkedIn and Twitter demonstrates an all-inclusive analytics dashboard. It ensures that every dimension of engagement is measured and fulfills the organizational communication goals.
Template 2: KPI Dashboard For Tracking Policy Management Progress
This dashboard software provides a comprehensive technological tool for managing all business policies from their initiation to their validation processes, monitoring their expiration, and aiding in the evaluation of feedback.
Our PPT Model also incorporates risk assessment by controlling evaluation policies to more specific levels, such as no related controls. These gaps help identify non-compliance risks at the level of ever-increasing compliance needs.
The most notable feature of this dashboard is its visual reporting function. Feedback and validation statuses can easily be relayed using pie charts and horizontal bar graphs. Download it to improve corporate governance by optimizing policy analysis and reporting.

Template 3: Policy Compliance and Threat Protection Dashboard
This particular reporting tool is intended to capture the entire organization in accordance with its security posture and compliance in a real-time manner. Moreover, it provides cyber risk assessment for This includes compliance monitoring, threat assessment, and resource vulnerability diagnosis, which together proactively manage cyber risks.
At its core, this template facilitates decision support by providing measures of compliance and several other regulatory achievements that provide the necessary structure for the proposed insights.
This dashboard acts as an interface that provides real-time data, facilitating effortless decision-making, continuous enhancement, and efficient governance.

Template 4: Insurance Policy Dashboard with Number and Cost of Claims
This dashboard augments compliance monitoring by outlining the claim frequency, average claim cost, and claim cost per policy. Centralizing this data enables organizations to maintain regulatory compliance and adherence to internal benchmarks.
This dashboard also falls under the integrated umbrella of business intelligence systems and enables better risk forecasting and strategic planning by letting companies discover trends in claims.
A standout feature of this PPT Slide is its exceptional report generation functionality. These features make it applicable in all areas of the insurance business.

Template 5: Auto Insurance Policies Claims Dashboard
This presentation template offers excellent value as a communication and analysis tool for insurers, claims managers, and analysts. Its main function is to graphically convey significant metrics concerning the policies and claims activity of the organization’s automobile insurance lines.
Furthermore, it contributes significantly to stakeholder engagement as it enables performance metrics coupled with exposure to be communicated in an intuitive and compelling manner.
In addition, the dashboard is extremely proficient in data storytelling. Claim this dashboard and mobilize your insurance specialists to improve organizational performance.

Template 6: Monthly Auto Insurance Policies Status Dashboard Template
This PPT Slide provides an illustrative summary of auto insurance policy activities on a monthly basis. This includes information on policies in force, new enrollments, cancellations, renewals, and others.
Moreover, in combination with other dashboards, this dashboard is essential in strategic planning by providing real-time status regarding how executives and analysts need to navigate policy optimizations relative to their intended strategies and objectives.
Its effective user interface design ensures that further insights are easily obtainable so that clients can better serve their companies. In turn, this grants users the ability to respond quickly within a highly competitive marketplace for insurance services.

Template 7: Auto insurance policy claims analysis dashboard Snapshot
This dashboard serves as a critical asset for modern insurance providers. It enhances policy management by tracking claim trends and performance while leveraging advanced reporting tools to support transparency, accountability, and continuous process improvement. It ensures insurers and decision-makers can track, analyze, and evaluate claim volumes, statuses, costs, and approval timelines in a centralized and accessible format.

Template 8: Home Insurance Dashboard with Policyholder Details and Claim Status
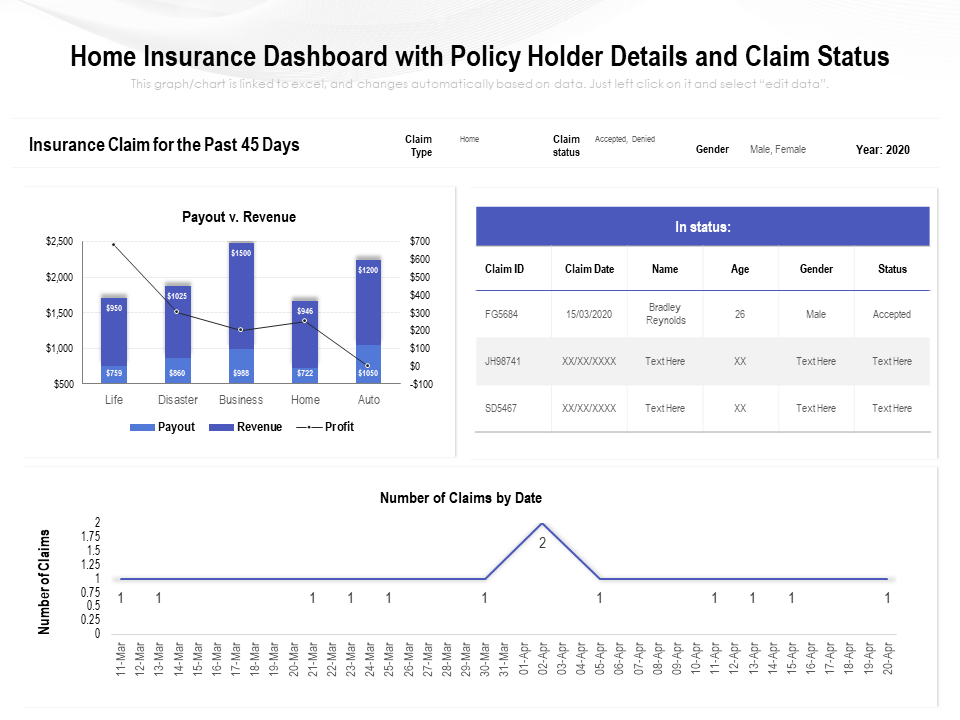
This PPT Slide organizes and highlights relevant details pertaining to the policyholder, claim history, and insurance status. This dashboard is designed to streamline the tracking and management of home insurance activities.
The presentation design is uniquely formed to focus on evaluation of policies. An explanation of account statements linked to claims can be provided which makes the assessment of policies, the risks associated with the customers, and the impact of the claims on the business more effective.
Wrap-Up: Where Policy Meets Progress
In every organization, policies should help—not hinder. And with the right dashboard, they do exactly that.
Through Policy Dashboard Templates, SlideTeam equips compliance officers, operations managers, and corporate strategists with sophisticated analytics-ready frameworks that seamlessly integrate style, structure, and decision-making.
With SlideTeam, every dashboard advances policy documentation toward performance optimization and policy enforcement integration.
Are you ready to craft persuasive policies? Avoid starting from the beginning. Start with SlideTeam.
PS:
FAQs on Policy Management
Q1. What is a policy dashboard?
Ans: A policy dashboard is a visual reporting tool that assists in tracking, monitoring, and presenting vital data associated with policy implementation, adherence, and performance. It is applied in governance, insurance, and business areas to facilitate policy evaluation, improve transparency, and aid strategy as well as compliance planning.
Q2. What are the three layers of dashboards?
Ans: The three levels of dashboards include
- Strategic Dashboards: Directed toward high-ranking executives and important stakeholders.
- Analytical Dashboards: Targeted towards data analysts and middle management
- Operational Dashboards: Designed for the daily tracking of processes and activities
Q3. What is the 5-second rule for dashboards?
Ans: According to the 5-second rule, a dashboard must convey at least the essential information in five seconds. In this sense, it helps guarantee that dashboards are uncluttered, streamlined, and user-friendly. By emphasizing KPI tracking and well-structured reporting tools and graphics, this rule seeks to optimize decision support by enabling stakeholders to rapidly understand key performance indicators and make timely decisions.