


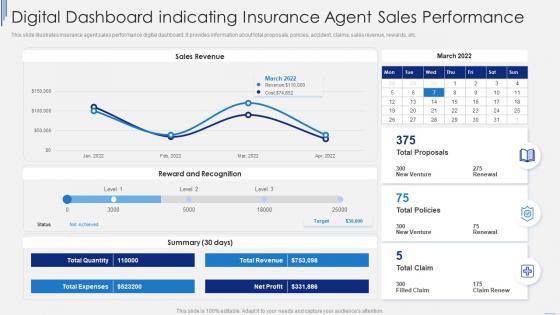
Digital Dashboard Indicating Insurance Agent Sales Performance




Try Before you Buy Download Free Sample Product
 Impress Your
 Audience
 100%
100% Editable
 Save Hours
 of Time


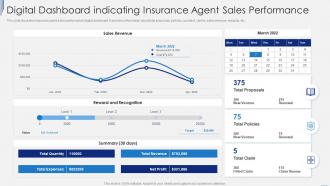
This slide illustrates insurance agent sales performance digital dashboard. It provides information about total proposals, policies, accident, claims, sales revenue, rewards, etc.
People who downloaded this PowerPoint presentation also viewed the following :
Digital Dashboard Indicating Insurance Agent Sales Performance with all 7 slides:
Use our Digital Dashboard Indicating Insurance Agent Sales Performance to effectively help you save your valuable time. They are readymade to fit into any presentation structure.





FAQs for Digital Dashboard Indicating Insurance
Effective digital dashboards should include revenue growth, customer acquisition costs, conversion rates, operational efficiency metrics, and real-time sales performance indicators. These metrics enable organizations to monitor cash flow, track marketing ROI, and identify bottlenecks across departments, with many companies finding that comprehensive dashboards streamline decision-making and ultimately deliver faster responses to market changes.
Data visualization techniques enhance digital dashboard effectiveness by transforming complex datasets into intuitive charts, graphs, heat maps, and interactive elements that enable faster decision-making. These approaches streamline information processing, minimize cognitive load, and highlight critical trends, with many organizations finding that strategic visualization ultimately delivers improved operational efficiency and competitive advantage.
Popular tools for creating customizable digital dashboards include Tableau, Power BI, Google Data Studio, Looker, and Qlik Sense, alongside specialized platforms like Grafana and Sisense. These solutions streamline data visualization by offering drag-and-drop interfaces, real-time analytics, and seamless integration capabilities, with many organizations finding that strategic dashboard implementation enhances decision-making speed and operational efficiency.
UX design principles enhance digital dashboard usability by prioritizing intuitive navigation, clear visual hierarchy, responsive layouts, and consistent interface elements. These principles streamline data interpretation through strategic color coding, optimized white space, and logical information architecture, with many organizations finding that well-designed dashboards reduce decision-making time while improving user adoption and operational efficiency.
Best practices for ensuring data accuracy and reliability include implementing automated data validation, establishing clear data governance protocols, conducting regular audits, maintaining consistent data sources, and creating real-time monitoring systems. These approaches streamline decision-making by minimizing errors, enhancing trust in analytics, and delivering consistent insights, with many organizations finding that robust data frameworks ultimately provide competitive advantage and operational efficiency.
Real-time data integration transforms decision-making by providing instant access to current information, eliminating delays from outdated reports, and enabling immediate responses to changing conditions. This capability allows executives to identify trends faster, adjust strategies dynamically, and respond to market shifts within minutes rather than days, ultimately delivering competitive advantage through accelerated, data-driven decisions.
Mobile-responsive designs ensure digital dashboards adapt seamlessly across devices, enabling users to access critical business insights on smartphones, tablets, and desktops with consistent functionality and readability. This accessibility empowers field teams, remote workers, and executives to make data-driven decisions anywhere, ultimately enhancing operational agility and competitive responsiveness in today's increasingly mobile business environment.
Organizations leverage digital dashboards to monitor customer satisfaction through real-time feedback tracking, sentiment analysis, support ticket resolution rates, and engagement metrics across multiple touchpoints. These integrated platforms enable businesses to identify trends, predict customer behavior, and respond proactively to concerns, with many retail and financial services companies finding that centralized monitoring ultimately delivers enhanced customer experiences and improved retention rates.
Common digital dashboard design mistakes include cluttered layouts, irrelevant metrics, poor visual hierarchy, inconsistent data sources, and lack of user-specific customization. These design pitfalls undermine decision-making effectiveness by overwhelming users with information overload, reducing data accuracy, and creating confusion, with many organizations finding that streamlined, role-based dashboards ultimately deliver faster insights and improved operational efficiency.
Data storytelling enhances digital dashboards by creating logical narrative flows, incorporating contextual annotations, using progressive disclosure techniques, and designing intuitive visual hierarchies that guide users through key insights. Through interactive elements like drill-down capabilities and time-based animations, organizations can transform static data presentations into compelling narratives, ultimately enabling stakeholders to understand trends and make faster, more informed strategic decisions.
Digital dashboard privacy and security considerations include data encryption, role-based access controls, secure authentication protocols, audit trails, and data anonymization techniques. These safeguards streamline compliance by protecting sensitive information, controlling user permissions, and maintaining transparent access logs, with many financial services and healthcare organizations finding that comprehensive security frameworks ultimately deliver regulatory adherence while enabling confident data-driven decision making.
Digital dashboards enable businesses to track marketing campaign performance by consolidating real-time metrics like conversion rates, ROI, customer acquisition costs, and engagement levels across multiple channels. These visualization tools streamline campaign monitoring through automated reporting, predictive analytics, and cross-platform integration, with many marketing teams finding that centralized dashboards ultimately deliver faster optimization decisions and significantly improved campaign effectiveness.
Cloud-based digital dashboard solutions offer scalability, real-time collaboration, automatic updates, reduced IT overhead, and seamless integration across multiple data sources. These platforms enable organizations to deploy dashboards faster while minimizing infrastructure costs, with many financial services and retail companies finding that cloud solutions deliver enhanced accessibility and streamlined maintenance, ultimately providing competitive advantage through agile business intelligence.
Collaboration features within digital dashboards facilitate team communication by enabling real-time data sharing, centralized commenting systems, automated alerts, and shared visualization access across departments. These tools streamline decision-making processes by ensuring all stakeholders view consistent information simultaneously, while integrated notification systems and collaborative annotations enhance transparency, ultimately delivering faster project coordination and improved organizational alignment.
Emerging digital dashboard trends include AI-powered predictive analytics, real-time collaborative interfaces, voice-activated controls, augmented reality visualizations, and automated anomaly detection capabilities. These technologies enhance decision-making by delivering proactive insights, streamlining team coordination, and enabling hands-free data interaction, with many organizations finding that predictive dashboards significantly reduce response times and improve strategic planning outcomes.
-
Good research work and creative work done on every template.
-
Easily Editable.