


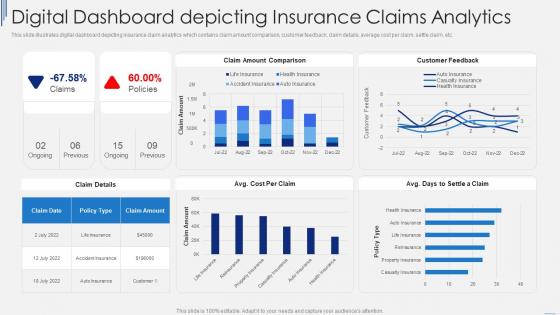
Digital Dashboard Depicting Insurance Claims Analytics




Try Before you Buy Download Free Sample Product
 Impress Your
 Audience
 100%
100% Editable
 Save Hours
 of Time


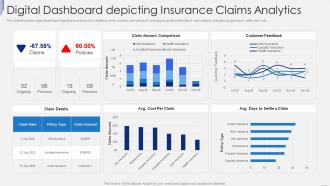
This slide illustrates digital dashboard depicting insurance claim analytics which contains claim amount comparison, customer feedback, claim details, average cost per claim, settle claim, etc.
People who downloaded this PowerPoint presentation also viewed the following :
Digital Dashboard Depicting Insurance Claims Analytics with all 7 slides:
Use our Digital Dashboard Depicting Insurance Claims Analytics to effectively help you save your valuable time. They are readymade to fit into any presentation structure.





FAQs for Digital Dashboard Depicting
So the big ones you'll see everywhere are loss ratios and combined ratios - that's your bread and butter stuff. Loss ratio is just claims vs premiums, pretty straightforward. Combined ratio throws in operating costs too (over 100% means you're bleeding money, obviously not ideal). Track frequency and severity metrics monthly to catch trends before they bite you. Oh, and predictive scores are huge for pricing policies upfront - honestly wish more people used them properly. Pull these reports monthly and watch for any weird spikes that need digging into.
Dude, ML will totally change how you handle underwriting. You can ditch the old-school demographic stuff and dig into crazy amounts of data - social media patterns, driving behavior, whatever. The algorithms catch things we'd never notice and knock out applications in seconds instead of weeks. Honestly, it's pretty wild how much more accurate the risk predictions get. Your models just keep learning from new info, so they actually improve over time without you doing anything. Start with just one product line though - you don't want to bite off more than you can chew right away.
You can pull in huge amounts of claims data and mix it with outside stuff - weather, demographics, even what people post on social media. That's where the real insights are hiding. The cool part? Combining your internal claims with external sources predicts both frequency and cost. Telematics shows how people actually drive, satellite images reveal property risks, IoT sensors catch equipment about to fail. Honestly, start by figuring out which external data actually matches your claim patterns first. That's your quickest win for better predictions.
So basically you'll want to group customers by risk, behavior, and how much they're worth over time. Demographics and claims history are your starting points. Then pile on payment habits, policy tweaks, engagement stuff - there's honestly no end to the data you can use. Machine learning catches weird patterns you'd miss, like people who look safe but file tons of tiny claims. Make sure your underwriting and marketing folks can actually do something with these groups though. Oh and don't go crazy - maybe 4 or 5 segments max when you're getting started.
Look, the big ones are fairness, transparency, and consent. Your algorithms can totally screw over certain groups - like making whole demographics basically uninsurable. Most customers have zero clue how their data impacts their rates (tbh, half the people in our industry don't either with these black box models). Privacy's another headache since you're dealing with personal info. You'll want to build in bias checks, be straight with people about what data you're using, and audit your models regularly. Otherwise you're asking for trouble.
So predictive analytics flags sketchy claims before you waste time digging into them manually. The system looks at historical patterns - claim amounts, timing, where they're coming from, how people behave. Honestly, it catches things I'd never notice. Each new claim gets a fraud risk score, and the algorithms learn from past confirmed fraud cases. You can focus your team on the high-risk stuff instead of randomly reviewing everything. Way more efficient. Start by figuring out what your biggest fraud red flags are, then feed that into the model. It'll save you tons of time.
Oh man, data format mismatches will drive you absolutely insane. Your old systems are storing stuff in formats that modern tools basically hate. APIs? What APIs - half these legacy systems don't even have proper ones for real-time extraction. Security gets messy fast when you're connecting ancient mainframes to cloud analytics. Performance bottlenecks are guaranteed since you're dealing with tech from like the Stone Age. And good luck finding someone who actually knows the old system inside out! Start with mapping your data flows, then figure out what integrations you actually need versus what would just be cool to have.
So real-time analytics is pretty sweet - you catch claims problems right when they pop up instead of finding out way too late. Fraud detection happens instantly, which honestly saves you tons of money. Your customers actually know what's going on with their claims instead of being left hanging, which they love. Claims get routed to the right people automatically based on how complex they are. I'd probably start with automating that initial sorting process - that's where you'll see the biggest time savings right off the bat. Way better than the old system where everything just sat in a queue.
Honestly, regulatory stuff controls pretty much everything you can do with analytics. Think of it like guardrails - GDPR, insurance regs, all that jazz. Your models have to be fair, transparent, explainable. Some places are getting really nitpicky about AI bias in pricing too (which, fair enough I guess). Don't try to slap compliance on afterward - build it in from the start. Way easier that way. First step is figuring out which regulations actually apply to what you're doing, then work those requirements into your project planning from day one.
Honestly, analytics is where the magic happens - it shows you exactly what gaps exist in the market. Pull your claims data from the past two years and look for patterns. What's causing the biggest losses? That's your goldmine right there. Customer behavior tells you what people really want, not what you assume they want (and trust me, there's always a massive disconnect). Telematics totally revolutionized car insurance with usage-based pricing. Your claims trends reveal new risks before anyone else catches on. Start with your top loss categories and figure out what products could prevent or cover those better.
So GIS basically lets you map out risk patterns across your whole portfolio - way better than staring at spreadsheets all day. You can stack different data layers like flood zones, crime stats, wildfire history on top of each other. Pretty wild when you see it all come together visually. Honestly, most people don't realize how much geography affects their risk until they actually map it out. You'll spot clusters and trends that weren't obvious before. Try plotting your current claims data first - I bet you'll find some surprising hotspots that'll help you price policies better.
So sentiment analysis basically reads through all your customer feedback - reviews, emails, social posts - and figures out if people are happy, pissed off, or whatever about your services. Think of it like having someone sort thousands of comments into "love you," "hate you," and "meh" buckets, but way faster. The cool part? It catches problems early. Like if everyone suddenly starts bitching about slow claims processing, you'll know before it snowballs. I'd start with your recent surveys and claim feedback first - see what patterns come up. Way easier than reading through everything yourself, honestly.
Dude, it's all about real-time monitoring now. Companies are ditching the old demographic stuff and actually tracking how people drive, their health data, lifestyle habits - the whole nine yards. Auto telematics is bleeding into life insurance too, which feels kinda creepy if I'm being honest. But here's the kicker: AI can predict claims before they even happen. Pricing is getting super personalized based on your actual behavior instead of just grouping you with everyone else. You should probably start testing some behavior-based programs soon because everyone else already is.
So basically you dig into your customer data to predict future premiums, renewals, and claims over however long they'll stick around. Historical stuff is your friend here - retention rates, how premiums typically grow, claims patterns by different customer types. The math honestly gets pretty gnarly with discount rates and churn probabilities, but man the insights are worth it. Don't forget acquisition costs and servicing expenses. Cross-selling potential matters too. Once you've got your CLV models figured out, use them to decide where to spend your retention budget. Focus on the customers who'll actually make you money long-term.
So for insurance data viz, start with what your audience actually cares about - their biggest headaches. Dashboards showing loss ratios, claim frequency, and customer lifetime value are money. Executives eat up those clean, simple views. Heat maps are perfect for showing geographic risk patterns (honestly, the visual impact is crazy). Trend lines help you catch seasonal stuff - claims have way more seasonality than you'd think. Always throw in benchmarks so people can see how they're doing versus targets. Don't go overboard cramming everything into one screen though. Keep colors consistent across reports.
-
Innovative and Colorful designs.
-
Amazing product with appealing content and design.