

 0 Comment
 Customer Reviews

Purchasing property tends to seem relatively simple—an enjoyable experience that lets you become a homeowner or an investor. This all involves a lot of decisions to make; comparing prices and potential returns is among them. Using comprehensive property comparison templates can make this process a lot smoother and more well-informed. Real estate platforms often offer templates of these as well, which break down the main factors, including pricing, location, amenities, and market trends of different options to analyze side by side.
Our Top 10 Property Comparison Templates with Examples and Samples can help you at each step of the decision-making process. They use their skills to evaluate residential, commercial, and rental properties and help make sense of elements like size, financial, and long-term value. Whether you're a first-time buyer or a seasoned investor, these templates will prove to be invaluable tools in making property comparisons and increasing the efficiency of your decisions, enabling you to make the most intelligent decisions for your purposes.
Template 1: Property Comparison PPT Set
Ideal for streamlining the process of property evaluation and decision-making in the real estate market, the PowerPoint template bundle includes This Property Comparison Template Bundle. Comprising 14 slides crafted with meticulous care, this bundle embodies a thorough rundown of how to differentiate and analyze the differences between properties ranging from residential spaces to, even more specifically, immersed financial differences such as rent vs. lease. This bundle comes along with various slides, which further break out the important steps in property comparison by factors such as price, location, and amenities, so nothing gets forgotten. On the other hand, the House Property Comparison Analysis Matrix delivers a structured means of evaluating the different options on a side-by-side comparison, and it also makes the discussion of strengths and weaknesses more manageable. This bundle contains each slide as a vital part of the comprehensive analysis, which aids in well-informed choice in property acquisition and leasing.
[product_image id=812697]
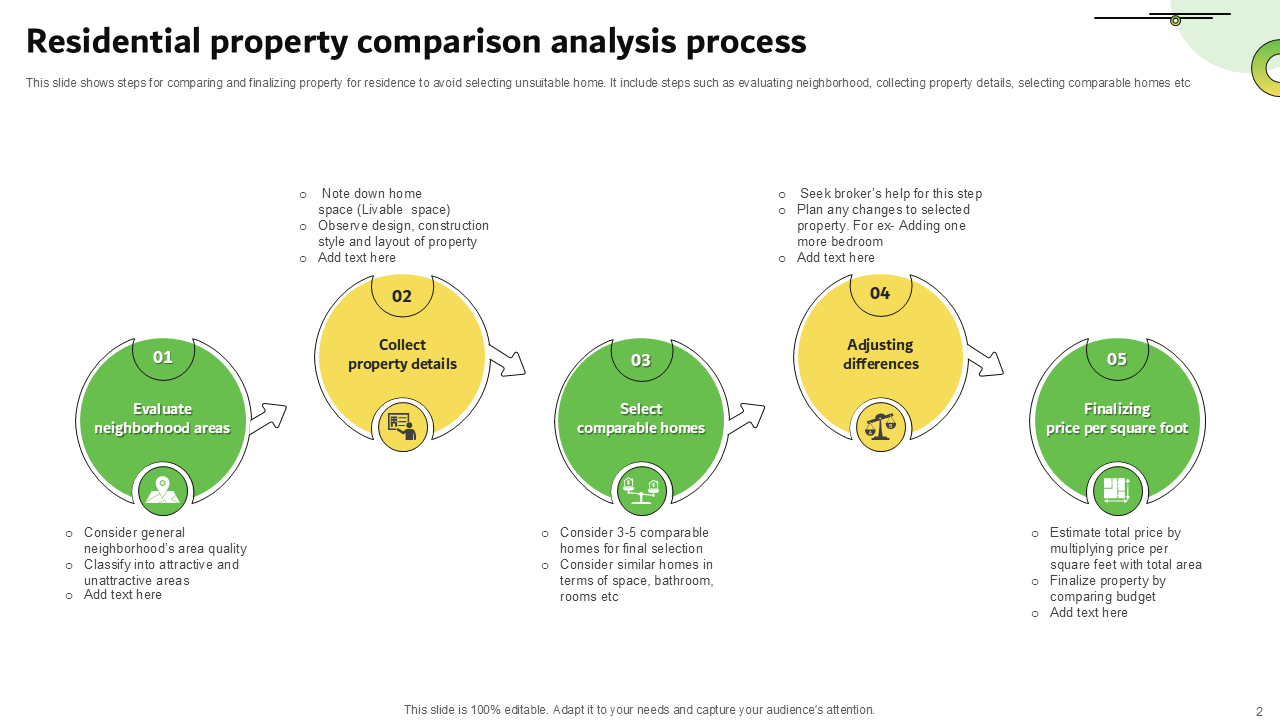
Template 2: Residential Property Comparison Analysis Process
If you're on the journey of discovering the perfect home, this slide can be referred to by any of you. This slide helps simplify and refine your residential property search process into a simple, clear, and actionable plan to help you ensure you scrutinize all the critical decisions before finalizing. Every step is carefully crafted to help you determine which properties you should include—by comparing aspects such as where it sits, amenities, price, and neighborhood details. Following this structured approach prevents you from making a hasty and probably ill-advised home choice, but it ensures that it meets your lifestyle and financial objectives. The insights in this slide help you choose a new home with confidence and ensure it's well suited to your needs.
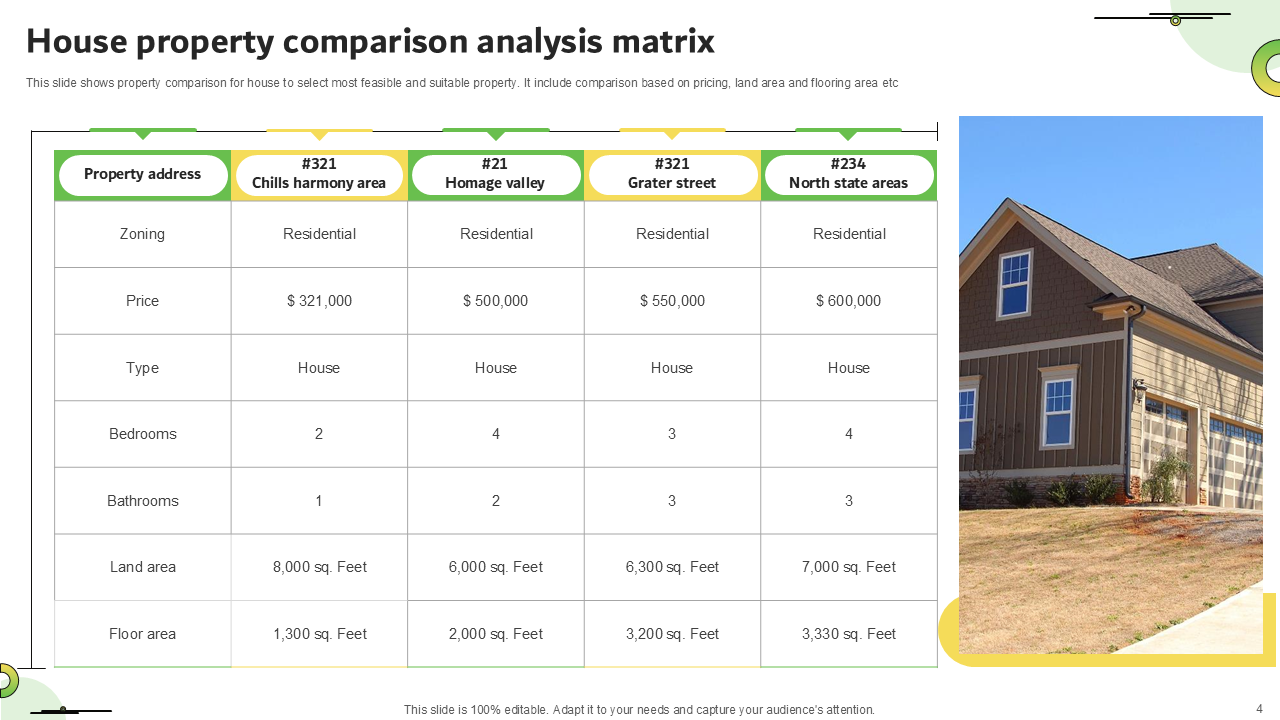
Template 3: House Property Comparison Analysis Matrix
This slide is a vital and powerful asset to anyone making an educated decision about residential property investment. This slide shows a structured comparison matrix of various crucial aspects like price, land area, floor space, etc. As they are organized side by side, they act to form a clear, visual framework of a structured set of elements with which it is easy to simplify complex comparisons as well as understand the strengths and weaknesses of each property. This matrix lets you quickly categorize how each option fits with your specific set of requirements: budget constraints, space requirements, etc. Besides bringing clarity to the decision-making process, the slide ensures that you are choosing the properties with a balanced view and that you are not hasty or uneducated in your choices.
Template 4: Leased VS Rented Property Comparison Matrix
The comparison slide is an extremely helpful way to see all the subtly different distinctions between leasing and renting. This slide outlines the unique attributes or points across different criteria like duration, payment terms, and flexibility. It helps specify which option is perfect for the needs or goals in question. It's easy to confuse leasing and renting in terms of what they are and how short-lived they are, but this matrix illustrates the way they differ in terms of commitment levels, return on investment, and outdated equipment. This slide makes it easier for you to make a strategic choice between these two depending on whether your lifestyle or investment plans line up with any one of these.

Template 5: Residential and Commercial Property Comparison Matrix
One of the Property Comparison Matrix slides gives a complete view of the distinctions between residential and commercial properties. This slide helps us differentiate along many dimensions, including use being intended for, lease term, return on investment, and maintenance responsibility to lend more clarity to the specific requirements and benefits of each property type. Looking at these factors side by side makes it quite easy to figure out which property category will sync up with set goals, be it for personal use or for business purposes. This matrix provides a balanced internal evaluation, supplying well-reasoned investment or use decisions that meet both current and prospective needs.

Template 6: Rental Types Property Comparison Matrix
This Comparison Matrix slide helps you decide on different kinds of rental property types, including bungalows, penthouses, etc. On this slide, we analyze each option to rent side by side, and then we break down the cost, space, privacy, amenities, and how well this lifestyle fits. This slide enables users to quickly understand how each property type compares to the others by organizing the attributes into a clear matrix format, making it very easy to pick the right one based on individual preference or budget constraints. From penthouses to bungalows to flats, this slide is designed to give you the most well-informed, balanced rental choice based on your lifestyle and financial priority.

Template 7: Real VS Financialized Economy Property Comparison Matrix
This slide is meant to simplify the tough call between investing in physical real estate or financialized property assets. The factors on this slide are broken down well (returns, risk, liquidity) for both options, giving you a good idea of which investment channel is right for you. This slide shows how tangible assets of (traditional) real estate can be secured and appreciated long-term and where (financialized) assets can include more liquidity and diversification. The comparison enables you to make a knowledgeable decision regarding what fits your appetite for danger, need for cash flow, and long-haul development wants, empowering your venture procedure to be a mitigated and strong one.

Template 8: Innovative Comparison Framework for Property Development
This slide offers a new angle from which to assess property development opportunities and is perfect for the strategy-minded investor or business looking to expand. This slide builds on an innovative framework to analyze elements such as market trends, business environment, and operational processes. Breaking these critical factors down helps us see where we have opportunities for growth and competitive advantage in different markets. This framework helps us take a holistic view that will encompass more than just the standard metrics, whether you are considering exploring new regions or comparing development prospects. With these insights, you're empowered with a rounded, future-facing mindset as you cast your decisions regarding investment or expansion, knowing you are making these decisions based on a firm grasp of risk and opportunity within dynamic property landscapes.

Template 9: Property & Facility KPI Dashboard Showing Tenant Category
This is a KPI Dashboard slide that gives a data-driven view of some important property management metrics in a single slide. This slide has interactive charts and graphs that can link to an Excel document with real-time tracking of things like vacancy history, lease expirations, and net operating income. These key performance indicators may be visualized thanks to the dashboard, which allows property managers and investors to monitor trends, forecast occupancy shifts, and make educated changes to increase profitability. This slide breaks down the various tenant categories as well as operational insights to help you make better, data-driven decisions on optimizing performance and property performance.

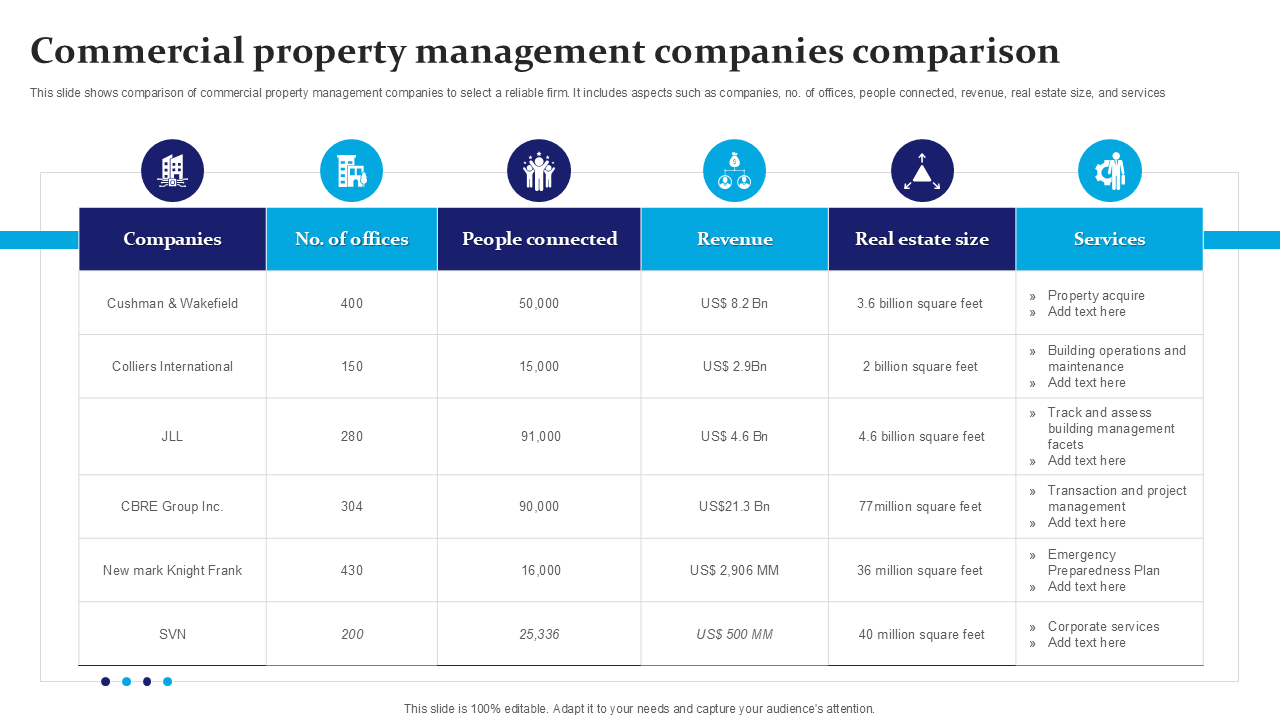
Template 10: Commercial Property Management Companies Comparison
This is a slide for evaluating and selecting the right firm to manage your property. This slide compares a few companies on the basis of the offices managed, the number of employees, revenue, the size of the real estate portfolio being managed, and the range of services they provide. Organizing these aspects side by side gives a clear and insightful view of each company's capabilities. It helps you determine which of the partners would be the most reliable and efficient. This will help you make an informed decision whether you are looking for a company with vast experience in large-scale properties or one with focused services where you need to check tangible performance indicators and the company's standing in the industry.
Final Word
If you want to learn more about real estate market trends, you can look through our Top 10 Market Analysis Real Estate Templates, which provide full sets of tools to assess the market. Also, check out our Top 10 Property Management System templates to save time and improve property oversight and operational efficiency. Lastly, our Top 10 Comparison Matrix Templates enable you to break down complex property data in a very clear and visual fashion. You will make smarter, more strategic property decisions with ease with these resources.