


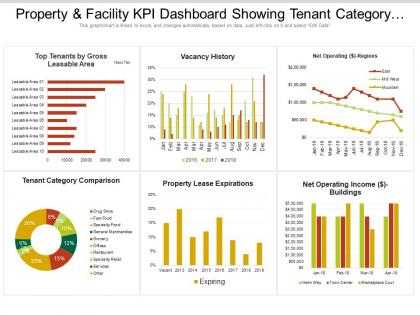
Property and facility kpi dashboard showing tenant category comparison and vacancy history




Try Before you Buy Download Free Sample Product
 Impress Your
 Audience
 100%
100% Editable
 Save Hours
 of Time


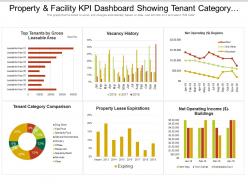
The property and facility KPI dashboard Slide is a 3 stage process which incorporates features like property and facility, property and talent, and goods and facility. This can be useful for property consultants or dealers to put forth the statement which shows features like top tenants by gross leasable area, vacancy history, net operating regions, tenant category comparison, property lease expiration, and net operating income buildings. The property consultants can stay aware of the various aspects related to the property and facility as well as they can aware their junior employees and the people associated with the consultancy firm. The property and facility dashboard Template can put forth a very suitable platform for the property dealers to present the total statement regarding the major aspects in front of senior members or the people associated to the consultancy company. The Template can be very useful for people to use and it can be proven a remarkable and exceptional platform in every possible way. Save the Slide to please your customers and the members on the higher authority in order to earn a great profit and that too in very less time. Dazzle the gathering with our Property And Facility Kpi Dashboard Showing Tenant Category Comparison And Vacancy History. They will be a feast for the eyes.
People who downloaded this PowerPoint presentation also viewed the following :
Property and facility kpi dashboard showing tenant category comparison and vacancy history with all 6 slides:
Give folks an example of your good fiber with our Property And Facility Kpi Dashboard Showing Tenant Category Comparison And Vacancy History. Be able to display depth of character.


FAQs for Property and facility kpi dashboard showing tenant category comparison
Key tenant satisfaction KPIs include tenant retention rates, response times to maintenance requests, rent collection efficiency, lease renewal percentages, and satisfaction survey scores. These metrics streamline property operations by identifying service gaps, optimizing resource allocation, and enhancing tenant experiences, with many property management companies finding that tracking these KPIs ultimately delivers higher occupancy rates and increased profitability.
Vacancy rates can be effectively tracked by calculating the percentage of unoccupied units monthly, monitoring average days vacant per unit, and analyzing seasonal patterns across different property types. Through automated property management systems, managers can identify trends, benchmark against market standards, and implement targeted leasing strategies, ultimately reducing turnover costs and maximizing rental income.
Maintenance response times serve as critical indicators of operational efficiency, tenant satisfaction levels, and overall service quality in property management. Faster response times significantly enhance tenant retention, reduce emergency repair costs, and strengthen property values, with many residential and commercial properties finding that streamlined maintenance workflows ultimately deliver competitive advantages and improved profitability.
Financial KPIs like ROI, cash flow ratios, cap rates, and net operating income provide property managers with data-driven insights to evaluate acquisition opportunities, optimize portfolio performance, and prioritize capital improvements. These metrics enable strategic decisions by identifying underperforming assets, comparing investment alternatives, and forecasting returns, ultimately delivering enhanced profitability and competitive advantage in property investment strategies.
Key operational efficiency KPIs include occupancy rates, average days to lease, maintenance response times, tenant retention rates, and cost per unit managed. These metrics enable property managers to streamline operations by identifying bottlenecks, optimizing resource allocation, and enhancing tenant satisfaction, with many real estate firms finding that tracking these KPIs delivers faster turnarounds and improved profitability.
KPI analysis minimizes tenant turnover by tracking lease renewal rates, tenant satisfaction scores, maintenance response times, and rent-to-market ratios. Through monitoring these metrics, property managers identify retention risks early, address maintenance issues proactively, and optimize pricing strategies, with many finding that data-driven tenant engagement ultimately reduces vacancy costs and enhances profitability.
Innovative data tracking methods include IoT sensors for real-time occupancy and energy monitoring, predictive analytics for maintenance scheduling, automated rent collection systems, tenant satisfaction surveys through mobile apps, and integrated dashboard platforms. These technologies streamline property operations by delivering faster maintenance responses, reducing operational costs, and enhancing tenant experiences, with many property management companies finding that comprehensive data integration ultimately provides significant competitive advantages.
KPIs can be tailored by focusing on tenant satisfaction, lease renewal rates, and maintenance response times for residential properties, while emphasizing occupancy costs, space utilization, and tenant retention for commercial assets. Property managers increasingly find that residential metrics prioritize community experience and quick service delivery, whereas commercial properties require strategic focus on operational efficiency, revenue optimization, and long-term tenant partnerships, ultimately delivering targeted performance insights.
Strategies include automated payment systems, early payment incentives, clear lease terms, proactive tenant communication, and streamlined collection processes. These approaches enhance cash flow by reducing late payments, minimizing administrative overhead, and improving tenant relationships, with many property management companies finding that combining technology with personalized outreach delivers significantly higher collection rates and operational efficiency.
Emerging technologies enhance property management KPI tracking through IoT sensors, AI-powered analytics, cloud-based dashboards, automated reporting systems, and predictive maintenance tools. These solutions streamline data collection, enable real-time monitoring of occupancy rates and maintenance costs, and deliver actionable insights, with many property managers finding that automated analytics significantly improve operational efficiency and tenant satisfaction.
Poor KPIs create cascading effects including declining tenant satisfaction, increased vacancy rates, higher maintenance costs, reduced property values, and weakened investor confidence. These operational inefficiencies compound over time, with many property management companies finding that inadequate performance tracking ultimately leads to portfolio deterioration, competitive disadvantage, and diminished profitability in an increasingly data-driven market.
Benchmarking against industry standards improves property management KPIs by identifying performance gaps, revealing best practices from top-performing properties, and establishing realistic improvement targets across metrics like occupancy rates, tenant satisfaction, and maintenance costs. This strategic comparison enables property managers to implement proven strategies, optimize resource allocation, and ultimately deliver enhanced operational efficiency while maintaining competitive advantage in increasingly demanding markets.
Staff training significantly enhances property management KPIs by improving tenant satisfaction scores, reducing maintenance response times, increasing lease renewal rates, and minimizing operational errors. Well-trained teams deliver faster issue resolution, more professional tenant interactions, and proactive maintenance practices, with many property management companies finding that comprehensive training programs ultimately reduce turnover costs while boosting overall portfolio performance and competitive advantage.
Customer feedback integrates into property management KPIs through satisfaction scores, Net Promoter Scores, response time metrics, complaint resolution rates, and tenant retention percentages. These quantitative measures enable property managers to track service quality trends, identify operational improvements, and benchmark performance across portfolios, ultimately delivering enhanced tenant experiences and competitive advantage in increasingly demanding markets.
Ethical KPI considerations include tenant privacy protection, fair treatment across demographics, transparent data collection practices, and avoiding discriminatory metrics. Property managers must balance operational efficiency with resident rights, ensuring KPIs like eviction rates or maintenance response times don't inadvertently penalize vulnerable populations, while maintaining accountability and fostering trust through ethical data usage.
-
Colors used are bright and distinctive.
-
Colors used are bright and distinctive.