


Business Operations Analysis Examples Powerpoint Presentation Slides


Try Before you Buy Download Free Sample Product
 Impress Your
 Audience
Editable
of Time


Our Business Operations Analysis Examples Powerpoint Presentation Slides are topically designed to provide an attractive backdrop to any subject. Use them to look like a presentation pro.
People who downloaded this PowerPoint presentation also viewed the following :
Content of this Powerpoint Presentation
Slide 1: This is the cover slide of Business Operations Analysis Examples PowerPoint Presentation.
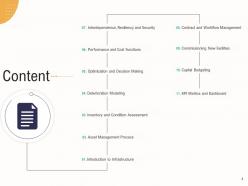
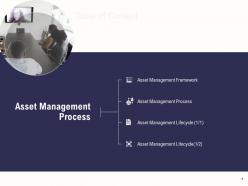
Slide 2: This is the Table of Contents slide that lists out all the elements covered in the deck.
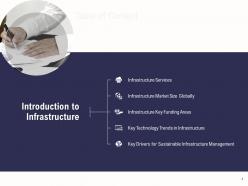
Slide 3: This slide presents Introduction to Infrastructure.
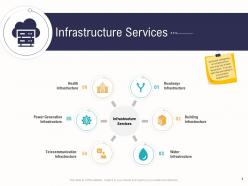
Slide 4: This slide presents different categories of Infrastructure services.
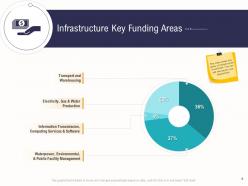
Slide 6: This slide shows key areas of infrastructure investment.
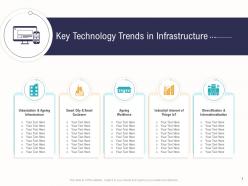
Slide 7: This slide shows Key Technology Trends in Infrastructure.
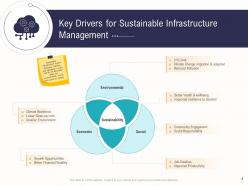
Slide 8: This slide shows Key Drivers for Sustainable Infrastructure Management
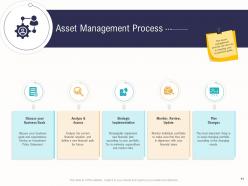
Slide 9: This slide presents assest management process.
Slide 10: This framework depicts an organisation's asset management responsibilities.
Slide 11: This asset management process can aid you in meeting your investment goals.
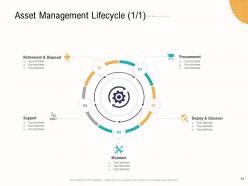
Slide 12: This is an Asset Management Lifecycle PowerPoint slide
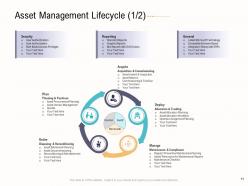
Slide 13: This is an Asset Management Lifecycle PowerPoint slide.
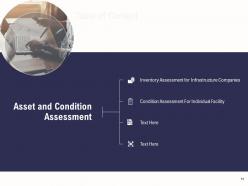
Slide 14: This slide presents asset and condition management.
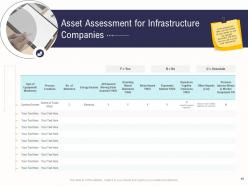
Slide 15: This slide incorporates an assessment table in which you can include all your assets as well any hazards associated with them.
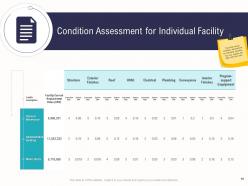
Slide 16: This slide shows condition assessment for individual facilities. You can replace the data with your own.
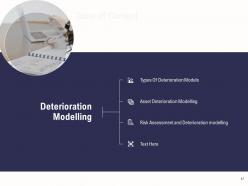
Slide 17: This slide presents deterioration modelling.
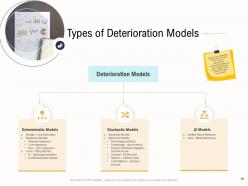
Slide 18: This slide presents types of deterioration models.
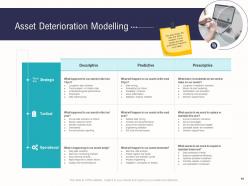
Slide 19: This slide shows the past and future condition of your assets and also prescriptive measures to be taken.
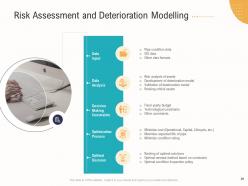
Slide 20: This slide presents risk assessment and deterioration modelling.
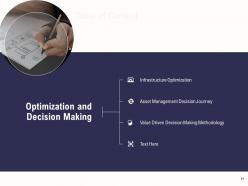
Slide 21: This slide presents optimization and decision making.
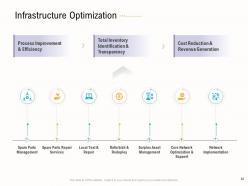
Slide 22: This slide talks about Infrastructure Optimization.
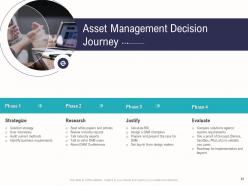
Slide 23: This slide presents asset management decision journey.
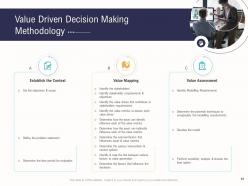
Slide 24: This slide talks about value driven decision making methodology.
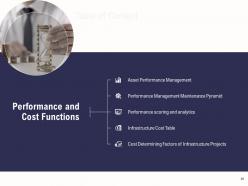
Slide 25: This slide presents performance and cost functions.
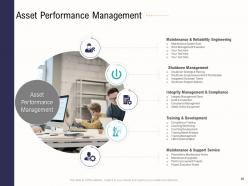
Slide 26: This slide presents Asset Performance Management.
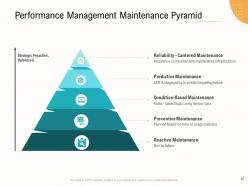
Slide 27: This slide presents Performance Management Maintenance Pyramid.
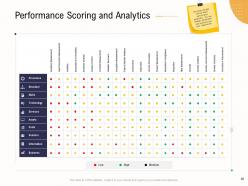
Slide 28: This slide includes various asset performance parameter. You can change parameters and scores to suit your requirement.
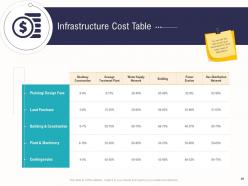
Slide 29: This slide presents Infrastructure cost table.
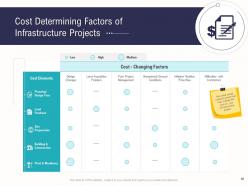
Slide 30: This slide shows various factors that may change the cost of your infrastructure project.
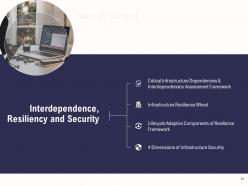
Slide 31: This slide presents interdependence, resiliency, and security.
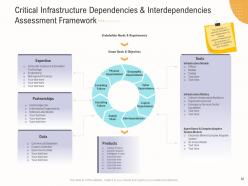
Slide 32: This slide presents critical infrastructure dependencies and interdependencies assessment framework.
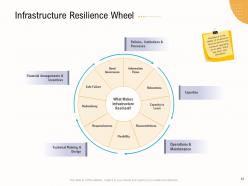
Slide 33: This slide showcases Infrastructure Resilience Wheel
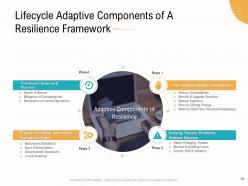
Slide 34: This slide talks about Lifecycle adaptive components of A Resiliency framework.
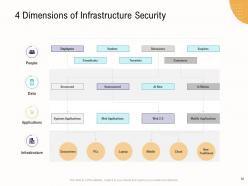
Slide 35: This slide presents 4 dimensions of infrastructure security.
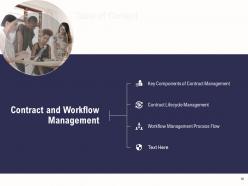
Slide 36: This slide presents contract and workflow management.
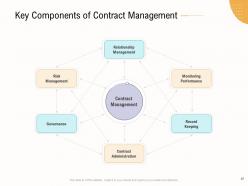
Slide 37: This slide presents Key Components of Contract Management
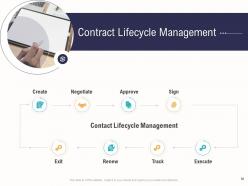
Slide 38: This slide presents Contract Lifecycle Management
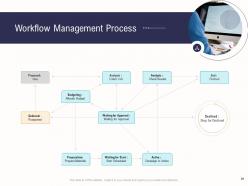
Slide 39: This slide talks about workflow management process.
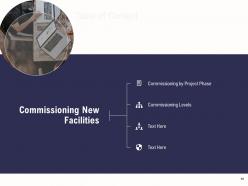
Slide 40: This slide talks about commissioning new facilities.
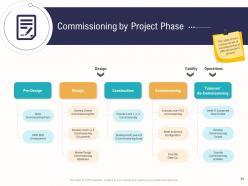
Slide 41: This slide shows various levels of commissioning at different project phases
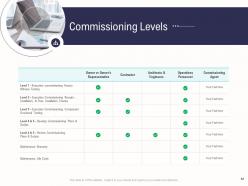
Slide 42: This slide presents Commissioning Levels.
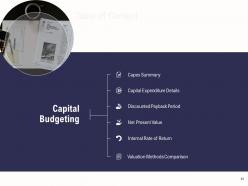
Slide 43: This slide talks about capital budgeting.
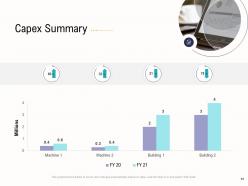
Slide 44: This slide presents capex summary.
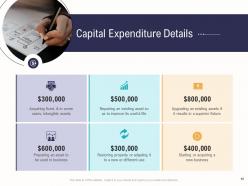
Slide 45: This slide presents capital expenditure details.
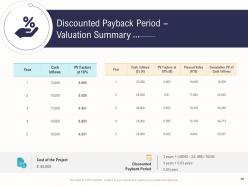
Slide 46: This slide talks about discounted payback period.
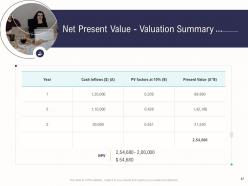
Slide 47: This slide presents net present value.
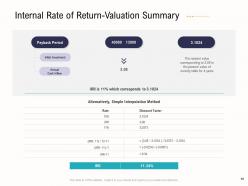
Slide 48: This slide presents Internal Rate of Return.
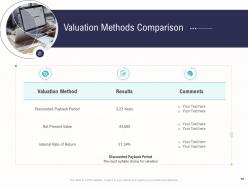
Slide 49: This slide presents Valuation Methods Comparison.
Slide 50: This slide presents KPI Metrics and Dashboard.
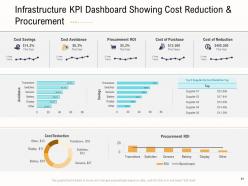
Slide 51: This slide presents Infrastructure KPI Dashboard Showing Cost Reduction & Procurement
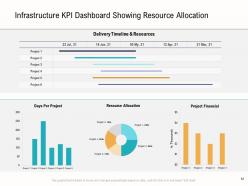
Slide 52: This slide presents Infrastructure KPI Dashboard Showing Resource Allocation
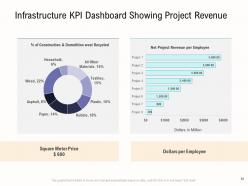
Slide 53: This slide presents Infrastructure KPI Dashboard Showing Project Revenue
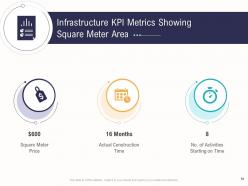
Slide 54: This slide presents Infrastructure KPI Metrics Showing Square Meter Area
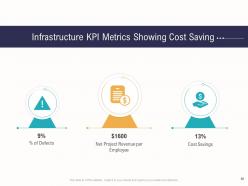
Slide 55: This slide presents Infrastructure KPI Metrics Showing Cost Saving
Slide 56: This is an Icon slide. Use it as per your needs.
Slide 57: This is an Additional Slide.
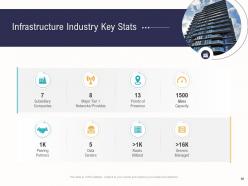
Slide 58: This slide presents Infrastructure Industry Key Stats
Slide 59: This is Our Mission slide to state your mission and vision.
Slide 60: This is Our Team slide with name and designation to fill.
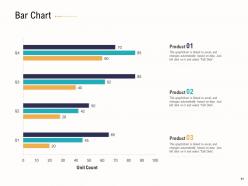
Slide 61: This is a Bar Chart slide that can be used to compare different products.
Slide 62: This is a Timeline slide that can be used to present chronological sequence of events.
Slide 63: This is a Post it Notes slide that can be used to keep the important data at one place.
Slide 64: This is a Roadmap slide that can be used to present series of events.
Slide 65: This is Our Goal slide that can be used to state your goals and aspirations.
Slide 66: This is a 30 60 90 Days Plan slide to create robust plans.
Slide 67: This is a Venn diagram slide that can be used to compare three different elements.
Slide 68: This is a Thank You slide for acknowledgment. You can share your contact details here.
Business Operations Analysis Examples Powerpoint Presentation Slides with all 68 slides:
Use our Business Operations Analysis Examples Powerpoint Presentation Slides to effectively help you save your valuable time. They are readymade to fit into any presentation structure.


FAQs for Business Operations Analysis Examples
Businesses should focus on KPIs including cycle time, throughput rates, resource utilization, cost per unit, and quality metrics like defect rates. These indicators streamline performance assessment by measuring speed, capacity, efficiency, financial impact, and output quality, with many organizations finding that tracking these metrics simultaneously delivers improved decision-making and competitive advantage.
Data analytics enables businesses to identify operational bottlenecks by analyzing workflow patterns, resource utilization rates, processing times, and performance metrics across departments. Through predictive analytics and real-time monitoring, organizations can pinpoint inefficiencies in manufacturing lines, customer service processes, and supply chain operations, ultimately streamlining operations and enhancing productivity.
Employee feedback serves as a critical diagnostic tool for identifying operational inefficiencies, process bottlenecks, workflow challenges, and resource allocation issues that management might overlook. Through regular surveys, suggestion systems, and structured interviews, organizations can streamline procedures, enhance productivity, and reduce operational costs, with many companies finding that employee insights deliver faster problem resolution and improved customer experiences.
Organizations can effectively measure technological investment impact through key performance indicators like processing time reduction, error rate decreases, cost per transaction improvements, and employee productivity metrics. By establishing baseline measurements before implementation and conducting regular assessments afterward, companies across sectors like banking and manufacturing can quantify efficiency gains, ultimately demonstrating ROI and identifying areas for further optimization.
Common pitfalls include overlooking data quality issues, focusing solely on symptoms rather than root causes, ignoring cross-departmental dependencies, inadequate stakeholder involvement, and rushing implementation without proper testing phases. These challenges can significantly impact analysis accuracy and strategic outcomes, with many organizations finding that comprehensive planning, collaborative approaches, and systematic validation processes ultimately deliver more reliable insights and sustainable operational improvements.
Businesses maintain operational agility by implementing flexible technology systems, cross-training employees for multiple roles, establishing real-time performance monitoring, and creating rapid decision-making frameworks. These approaches enable organizations to pivot quickly during market shifts, streamline resource allocation, and enhance customer responsiveness, with many companies finding that agile operations deliver significant competitive advantages and improved resilience.
Lean methodology, Six Sigma, Kaizen, Business Process Reengineering, and Theory of Constraints are highly effective for enhancing operational efficiency across organizations. These methodologies deliver results by eliminating waste, reducing defects, and streamlining workflows, with manufacturing companies, healthcare systems, and financial institutions finding that strategic combinations of these approaches ultimately provide significant cost reductions and competitive advantage.
Supply chain disruptions can be analyzed through risk mapping, performance metrics tracking, supplier assessment, scenario planning, and data analytics to identify vulnerabilities and bottlenecks. These analytical approaches enable organizations to develop contingency plans, diversify supplier networks, and build strategic inventory buffers, ultimately delivering enhanced operational resilience and competitive advantage in increasingly volatile markets.
Best practices for conducting comprehensive business operations audits include establishing clear audit objectives, assembling cross-functional review teams, mapping end-to-end processes, analyzing performance metrics, and documenting findings systematically. These practices enable organizations to identify inefficiencies, streamline workflows, and enhance resource allocation, with many companies finding that structured audits deliver measurable cost reductions and improved operational transparency.
Companies can align operational strategies with business objectives by establishing clear performance metrics, integrating cross-functional teams, conducting regular strategic reviews, and implementing data-driven decision-making processes. Through strategic planning frameworks, organizations streamline resource allocation, enhance operational efficiency, and accelerate goal achievement, with many companies finding that consistent alignment ultimately delivers competitive advantage and measurable business growth.
Essential tools for business operations analysis include process mapping software like Visio, data analytics platforms such as Tableau and Power BI, ERP systems, workflow automation tools, and performance dashboards. These technologies streamline analysis by visualizing complex processes, identifying bottlenecks, and tracking key metrics, with many organizations finding that integrated analytics platforms ultimately deliver faster decision-making and enhanced operational efficiency.
Businesses benchmark operational performance by conducting comparative analysis using industry reports, participating in peer benchmarking groups, leveraging third-party assessment tools, and analyzing key performance indicators against sector averages. Through platforms like industry associations and consulting frameworks, organizations identify performance gaps, optimize resource allocation, and enhance competitive positioning, with many companies finding that regular benchmarking drives measurable improvements in efficiency and profitability.
Process mapping enhances understanding by visualizing workflow sequences, identifying bottlenecks, revealing redundancies, documenting decision points, and clarifying role responsibilities across departments. Through detailed process visualization, organizations streamline operations, reduce cycle times, and improve resource allocation, with many manufacturing and financial services companies finding that mapped processes enable faster problem identification and strategic optimization opportunities.
Operational analysis informs product development decisions by identifying customer pain points, resource constraints, market demands, and performance gaps through data-driven insights. By analyzing workflow bottlenecks, user feedback patterns, and operational costs, development teams can prioritize features that enhance efficiency, reduce complexity, and deliver measurable value, ultimately creating products that align with market needs and operational realities.
Regulatory changes significantly impact business operations analysis by requiring updated compliance frameworks, revised risk assessments, modified workflow processes, and enhanced reporting mechanisms. These requirements drive organizations to streamline their analytical capabilities, automate compliance monitoring, and integrate regulatory considerations into operational decision-making, ultimately delivering improved transparency and competitive advantage through proactive adaptation.
-
Editable templates with innovative design and color combination.
-
Great product with highly impressive and engaging designs.
-
Really like the color and design of the presentation.
-
Out of the box and creative design.
-
Great designs, really helpful.
-
Use of different colors is good. It's simple and attractive.