


Business progress bar sample of ppt




Try Before you Buy Download Free Sample Product
 Impress Your
 Audience
 100%
100% Editable
 Save Hours
 of Time


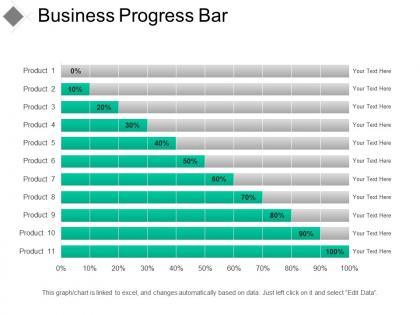
Demonstrate your business journey with the help of Business Progress Bar Sample Of PPT presentation. This business layout PPT background image contains a progress bar with which you can reveal your sales target achievement of particular products. This business achievement PowerPoint visual will help you in showing the risks, difficulties, outputs, project issues and targets achieved by your company. Unveil the company’s previous or current products, promotions, increased sales figures, rewards, economy, etc. with this business accomplishment PowerPoint slide. Take the help of this eye-catching company achievement PPT graphic and depict the targets that have been achieved by your company. This business accomplishment PowerPoint layout can even be used to analyze what the company is doing and what are its achievements so far. Draft a business progress report entailing the organizational goals and projections of the current year with this business roadmap PowerPoint infographic. Take advantage of this company winnings PPT template and show the challenges faced by your company and the steps to prevent the same. Utilize this business success PPT image to throw light on the winners, star performers, successful campaigns, competent employees, customer satisfaction and the other successful events. You can even add information such as volume high low close chart, area chart, idea generation, etc. to this competency management PowerPoint presentation. Thus, download this amazing organizational competency PPT icon and succeed in taking your business to great heights.
People who downloaded this PowerPoint presentation also viewed the following :
Business progress bar sample of ppt with all 5 slides:
Dig out the intelligence with our Business Progress Bar Sample Of Ppt. Get to discern the forces influencing events.
FAQs for Business progress bar
Key elements include clear milestones, percentage completion indicators, timeline markers, performance metrics, and visual status updates that track project advancement. These components enhance stakeholder communication by providing transparent progress tracking, identifying potential bottlenecks, and maintaining team alignment, with many organizations finding that structured progress presentations ultimately deliver improved accountability and faster decision-making across departments.
Visual metaphors enhance business progress understanding by transforming abstract data into intuitive, relatable concepts that audiences can quickly grasp and remember. Through progress bars, growth trees, and journey maps, organizations streamline complex performance metrics, financial milestones, and strategic initiatives into digestible visual stories, with many executives finding that metaphor-driven presentations accelerate decision-making and stakeholder alignment.
Colors in progress bar presentations convey critical information through visual psychology, status indication, brand alignment, urgency levels, and accessibility considerations. Different colors communicate distinct messages—green signals completion and success, red indicates delays or critical issues, yellow shows caution or pending status, while blue maintains professional neutrality, with many organizations finding that strategic color choices enhance audience comprehension and engagement significantly.
Animated progress bars improve audience engagement by providing visual milestones, maintaining attention through dynamic movement, and creating anticipation for upcoming content segments. These visual elements help audiences track presentation flow while reducing cognitive load, with many presenters finding that strategic animation timing enhances focus and prevents audience distraction during lengthy business presentations.
**INPUT**: What types of data are most effectively represented using a progress bar format? **OUTPUT**: Progress bars effectively represent goal completion percentages, project milestones, budget utilization rates, sales targets achievement, and performance metrics tracking. These visual elements streamline complex data interpretation by showing current status against benchmarks, enabling stakeholders to quickly assess progress across departments, with many organizations finding enhanced decision-making through immediate visual clarity. [Word count: 52 words]
Businesses can customize progress bars through brand colors, typography, visual elements, custom icons, and proportional styling that reflects their corporate aesthetic. These design modifications enhance brand consistency across presentations, with companies in retail, technology, and consulting finding that aligned visual elements strengthen professional credibility and audience engagement during stakeholder meetings.
Common mistakes include using unclear labeling, inconsistent visual scaling, overcrowded information, poor color choices that lack accessibility, and failing to show meaningful milestones. These design flaws undermine data comprehension by creating confusion rather than clarity, with many organizations finding that streamlined progress bars with consistent formatting, strategic color usage, and clear milestone markers significantly enhance stakeholder understanding and decision-making processes.
Progress bars showcase project milestones effectively by visualizing completion percentages, highlighting key deliverables, and providing clear timeline markers that stakeholders can quickly interpret. Through color-coding phases, integrating deadline indicators, and displaying percentage achievements, organizations streamline project communication, enhance team accountability, and maintain stakeholder confidence, with many finding that visual progress tracking significantly improves project transparency and decision-making speed.
Progress bars enhance storytelling by creating visual narrative structure, showing project phases, timeline progression, milestone achievements, and completion percentages throughout presentations. These visual elements guide audiences through complex business journeys, making abstract concepts tangible while building anticipation and maintaining engagement, ultimately delivering clearer communication and stronger stakeholder buy-in for strategic initiatives.
Progression metrics should align directly with strategic objectives, incorporating financial performance indicators, operational efficiency measures, customer satisfaction scores, market share data, and timeline adherence rates. These metrics work together by providing comprehensive visibility into goal achievement, enabling data-driven decision making, and ensuring accountability across departments, with many organizations finding that balanced scorecards deliver clearer strategic alignment.
**INPUT**: What tools and software are recommended for dynamic progress bars? **OUTPUT**: Recommended tools include PowerPoint, Prezi, Canva, Adobe After Effects, and specialized dashboard software like Tableau or Power BI. These platforms streamline progress visualization by offering customizable templates, real-time data integration, and interactive features, with many organizations finding that dynamic progress bars enhance stakeholder engagement and project transparency.
Progress bars integrate into presentation design through consistent color schemes, matching typography, aligned visual elements, and strategic placement within slide layouts. These design components streamline audience comprehension by maintaining visual hierarchy, enhancing brand consistency, and delivering seamless information flow, with many organizations finding that cohesive progress indicators ultimately improve stakeholder engagement and presentation effectiveness.
Interactive progress bars in virtual presentations enhance audience engagement, provide real-time feedback on presentation flow, enable strategic pacing control, and deliver visual clarity about remaining content. These tools streamline presenter confidence by offering navigation flexibility, reduce audience fatigue through clear expectations, and ultimately improve retention rates, with many organizations finding that interactive elements significantly boost virtual meeting effectiveness and participant attention spans.
Different industries customize progress bars to reflect sector-specific metrics and priorities, with healthcare tracking patient care milestones, manufacturing monitoring production phases, and financial services displaying loan approval stages. These visual tools enhance stakeholder communication by translating complex workflows into digestible formats, while retail organizations showcase campaign progress and tech companies demonstrate product development cycles, ultimately delivering clearer project transparency and improved decision-making across diverse business environments.
Recent trends in business progress bar presentation design include interactive dashboards, real-time data integration, mobile-responsive formats, multi-dimensional progress tracking, and AI-powered predictive indicators. These enhanced visualizations streamline stakeholder communication by delivering immediate insights, enabling dynamic reporting, and facilitating data-driven decision making, with many organizations finding that modern progress displays significantly improve project transparency and accelerate strategic alignment across teams.
-
Unique design & color.
-
Great quality slides in rapid time.