


Business Sustainability Performance Indicators Powerpoint Presentation Slides


Try Before you Buy Download Free Sample Product
 Impress Your
 Audience
Editable
of Time


KPIs are the core performance metrics business executives use to illustrate and measure overall business progress towards achieving strategic goals and performance objectives. Check out our professionally designed Business Sustainability Performance Indicators template that will be helpful to the manager of a company to measure its organizational performance. After providing a business overview, the company will compare its performance with its competitors using the competitive landscape analysis section. Parameters covered for comparison are foundation year, the number of employees, investor funding, operating profit, and net profit margin. After analyzing business performance, the company will set its short-term and long-term goals by using the business goals section. At last, the company will measure its performance using three sections metrics to assess financial profitability, employee performance measurement, and customer satisfaction. Metrics to assess financial profitability section includes dashboards of financial performance indicator, profit margin, cash flow, and effective rate. The Employee performance measurement section provides employee engagement and company culture dashboards, revenue and engagement cost, employee billable hours, and real-time utilization. Get access to this 100 percent editable template now.
People who downloaded this PowerPoint presentation also viewed the following :
Content of this Powerpoint Presentation
Slide 1: This slide introduces Business Sustainability Performance Indicators. State Your Company Name and begin.
Slide 2: This slide states Agenda of the presentation.
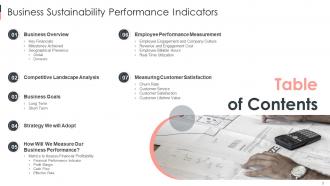
Slide 3: This slide presents Table of Content for the presentation.
Slide 4: This slide depicts title for two topics that are to be covered next in the template.
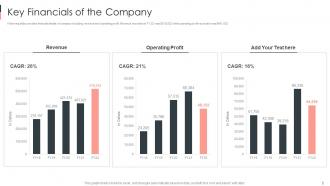
Slide 5: This slide provides financial details of company including revenue and operating profit.
Slide 6: This slide demonstrates monthly milestones achieved by the company in 2020 financial year.
Slide 7: This slide depicts title for two topics that are to be covered next in the template.
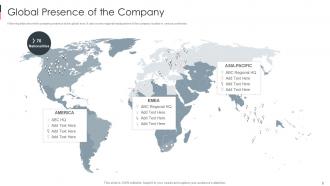
Slide 8: This slide shows the company presence at the global level.
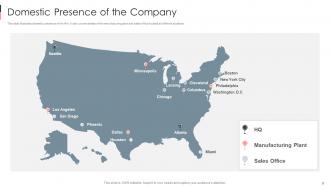
Slide 9: This slide illustrates domestic presence of the firm.
Slide 10: This slide depicts title for two topics that are to be covered next in the template.
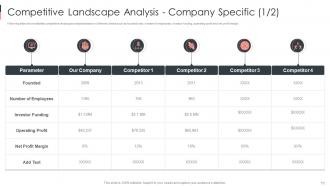
Slide 11: This slide shows detailed competitive landscape analysis based on different criteria such as founded year, number of employees, etc.
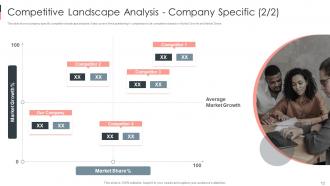
Slide 12: This slide shows company specific competitive landscape analysis.
Slide 13: This slide depicts title for three topics that are to be covered next in the template.
Slide 14: This slide shows long term goals set by the firm.
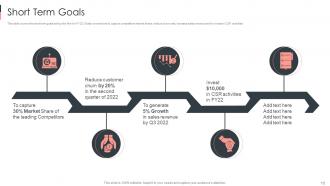
Slide 15: This slide covers the short term goals set by the firm for FY20.
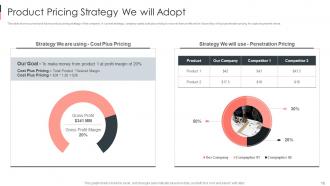
Slide 16: This slide shows current and future product pricing strategy of the company.
Slide 17: This slide depicts title for four topics that are to be covered next in the template.
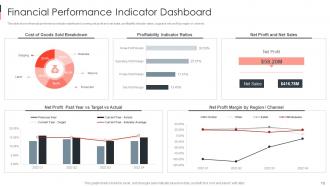
Slide 18: This slide shows financial performance indicator dashboard covering net profit and net sales, profitability indicator ratios, etc.
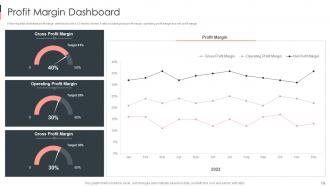
Slide 19: This slide illustrates profit margin dashboard with a 12 months format.
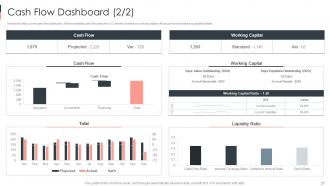
Slide 20: This slide covers cash flow dashboard covering details like beginning cash on hand, cash going in, cash going out, etc.
Slide 21: This slide covers cash flow dashboard.
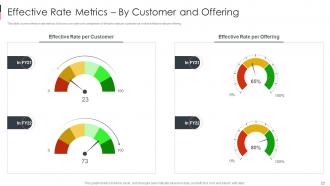
Slide 22: This slide covers effective rate metrics.
Slide 23: This slide depicts title for four topics that are to be covered next in the template.
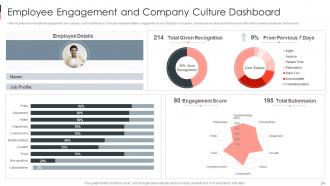
Slide 24: This slide shows employee engagement and company culture dashboard.
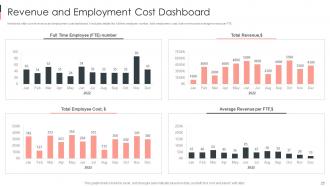
Slide 25: This slide covers revenue and employment cost dashboard.
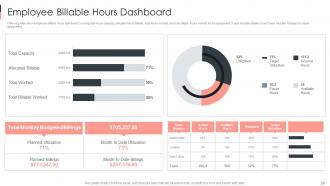
Slide 26: This slide shows employee billable hours dashboard covering total hours capacity, allocated hours billable, total hours worked, etc.
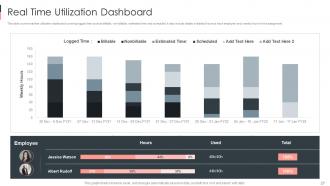
Slide 27: This slide covers real time utilization dashboard covering logged time such as billable, non-billable, estimated time and scheduled.
Slide 28: This slide depicts title for four topics that are to be covered next in the template.
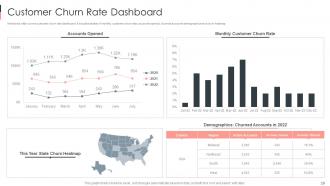
Slide 29: This slide covers customer churn rate dashboard.
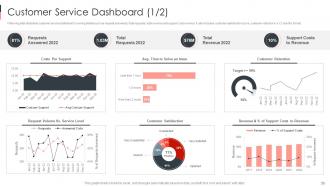
Slide 30: This slide illustrates customer service dashboard covering details such as request answered, total requests, total revenue and support cost revenue.
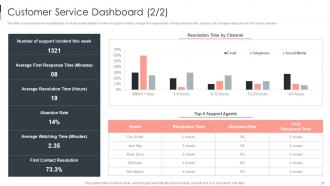
Slide 31: This slide covers customer service dashboard.
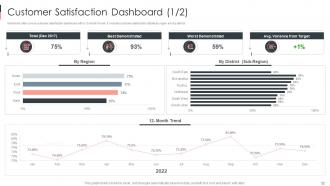
Slide 32: This slide covers customer satisfaction dashboard with a 12-month format.
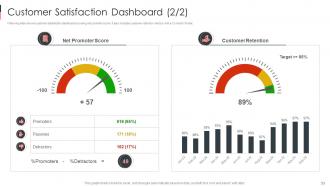
Slide 33: This slide shows customer satisfaction dashboard covering net promoter score.
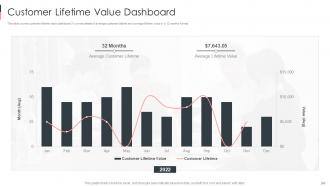
Slide 34: This slide covers customer lifetime value dashboard.
Slide 35: This slide displays Icons for Business Sustainability Performance Indicators.
Slide 36: This slide is titled as Additional Slides for moving forward.
Slide 37: This slide provides 30 60 90 Days Plan with text boxes.
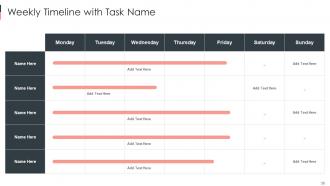
Slide 38: This slide shows Weekly Timeline with Task Name.
Slide 39: This slide presents Roadmap for Process Flow.
Slide 40: This slide depicts Venn diagram with text boxes.
Slide 41: This slide shows Post It Notes. Post your important notes here.
Slide 42: This is a Timeline slide. Show data related to time intervals here.
Slide 43: This is Our Goal slide. State your firm's goals here.
Slide 44: This is a Financial slide. Show your finance related stuff here.
Slide 45: This slide showcases Magnifying Glass to highlight information, specifications, etc.
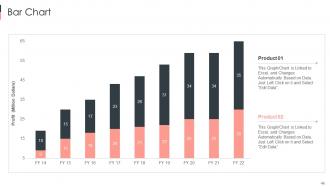
Slide 46: This slide presents Bar chart with two products comparison.
Slide 47: This is a Comparison slide to state comparison between commodities, entities etc.
Slide 48: This is a Thank You slide with address, contact numbers and email address.
Business Sustainability Performance Indicators Powerpoint Presentation Slides with all 53 slides:
Use our Business Sustainability Performance Indicators Powerpoint Presentation Slides to effectively help you save your valuable time. They are readymade to fit into any presentation structure.


-
Wow! The design and quality of templates on SlideTeam are simply the best.
-
The visual appeal of the templates is just unparalleled! I was so worried about the design of my presentation but SlideTeam made it all so easy.