


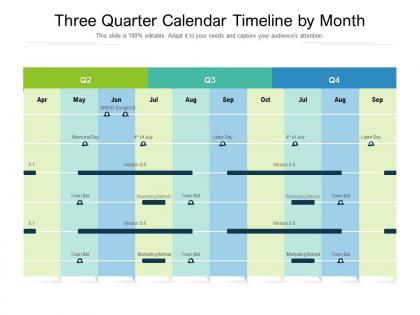
Three quarter calendar timeline by month




Try Before you Buy Download Free Sample Product
 Impress Your
 Audience
 100%
100% Editable
 Save Hours
 of Time


Our Three Quarter Calendar Timeline By Month are topically designed to provide an attractive backdrop to any subject. Use them to look like a presentation pro.
People who downloaded this PowerPoint presentation also viewed the following :
Three quarter calendar timeline by month with all 2 slides:
Use our Three Quarter Calendar Timeline By Month to effectively help you save your valuable time. They are readymade to fit into any presentation structure.
FAQs for Three quarter calendar
Key components include clear quarterly milestones, progress indicators, deliverable markers, resource allocation charts, and risk assessment sections. These elements work together by providing stakeholders with comprehensive project visibility, enabling better decision-making and resource planning, while many organizations find that structured quarterly reviews ultimately deliver improved accountability and strategic alignment across teams.
A three-quarter timeline visually represents project milestones and deadlines by displaying nine months of project phases, key deliverables, critical checkpoints, and deadline markers in a chronological flow. This extended format enables project managers to showcase detailed progression across multiple quarters, identify potential bottlenecks, and communicate realistic timelines to stakeholders, ultimately delivering enhanced project transparency and improved resource allocation planning.
A three-quarter timeline proves more beneficial when showcasing cyclical processes, quarterly business reviews, seasonal campaigns, or project phases that require visual emphasis on interconnected stages rather than strict chronology. This format enhances presentations for financial planning, marketing cycles, and strategic initiatives, with many organizations finding that the curved structure better demonstrates how different phases influence each other, ultimately delivering clearer stakeholder understanding and improved decision-making processes.
**INPUT**: What design elements should be considered when creating a three-quarter timeline for a corporate presentation? **OUTPUT**: Essential design elements include clear milestone markers, consistent color coding, readable typography, proportional spacing, and strategic visual hierarchy that guides audience attention. These elements work together by enhancing information flow, maintaining professional aesthetics, and ensuring key deliverables stand out, with many organizations finding that well-designed timelines significantly improve stakeholder comprehension and project buy-in during presentations.
Color coding enhances three-quarter timeline clarity by differentiating project phases, categorizing tasks by priority or department, and highlighting critical milestones or deadlines. This visual approach enables teams to quickly identify dependencies, track progress across multiple workstreams, and spot potential bottlenecks, ultimately streamlining project management and improving stakeholder communication efficiency.
**INPUT**: What software tools are best suited for crafting three-quarter timelines? **OUTPUT**: Software tools best suited for crafting three-quarter timelines include Microsoft Project, Smartsheet, Asana, Monday.com, and Gantt chart applications like GanttPRO. These platforms streamline project visualization by enabling milestone tracking, resource allocation, and progress monitoring, with many organizations finding that integrated timeline tools ultimately deliver enhanced project transparency and improved stakeholder communication across departments. **Word count**: 56 words
Three-quarter timelines are commonly utilized in software development sprints, quarterly business reviews, seasonal retail campaigns, academic terms, and construction project phases. Industries like technology, finance, manufacturing, and education frequently adopt these frameworks because they align with natural business cycles, enable regular performance assessments, and provide sufficient time for meaningful progress while maintaining momentum and accountability.
Narrative flow in three-quarter timeline presentations is achieved through strategic storytelling elements, clear chronological progression, compelling transition phrases, and visual consistency that guides audiences seamlessly from past through present to future. By incorporating milestone celebrations, challenge-to-solution arcs, and forward-looking strategic insights, organizations create engaging presentations that maintain audience attention while delivering comprehensive project updates and building stakeholder confidence in future outcomes.
Common pitfalls include underestimating task dependencies, failing to allocate buffer time for unexpected delays, overcommitting resources across multiple projects, and neglecting stakeholder communication checkpoints. These mistakes often derail quarterly objectives by creating bottlenecks, resource conflicts, and misaligned expectations, with many organizations finding that proactive planning and realistic scheduling ultimately delivers better project outcomes and team performance.
Audience engagement during three-quarter timeline discussions can be maximized through interactive progress tracking, milestone celebrations, visual storytelling techniques, and strategic stakeholder involvement. These approaches streamline communication by highlighting achieved outcomes, upcoming priorities, and strategic pivots, with many organizations finding that quarterly reviews combined with forward-looking insights ultimately deliver stronger buy-in and sustained momentum.
Interactive elements in three-quarter timelines include clickable milestones, hover-over details, expandable sections, embedded multimedia content, and dynamic filtering options. These features enhance audience engagement by allowing users to explore specific phases, access supporting documentation, and customize their viewing experience, with many organizations finding that interactive timelines significantly improve stakeholder comprehension and project communication effectiveness.
**INPUT**: What metrics or KPIs can be effectively illustrated using a three-quarter timeline? **OUTPUT**: Three-quarter timelines effectively illustrate quarterly revenue growth, project milestone completion rates, customer acquisition costs, seasonal sales performance, and operational efficiency metrics. These visualizations enable organizations to track year-over-year comparisons, identify trending patterns, and demonstrate progress toward annual targets, with many companies finding that quarterly breakdowns enhance strategic decision-making and stakeholder communication. [Word count: 54 words]
Historical events can be represented using a three-quarter timeline format by organizing chronological data across three-quarters of a circular or linear display, with the remaining quarter reserved for detailed annotations, contextual information, or thematic analysis. This approach enables historians, educators, and organizations to present complex historical narratives while maintaining visual clarity, with many museums and educational institutions finding that this format enhances audience engagement and comprehension.
Storytelling transforms three-quarter timelines from static schedules into compelling narratives by creating emotional connections, highlighting key milestones as plot points, and demonstrating progress through character development. This approach enables organizations to communicate complex project journeys more effectively, engage stakeholders through relatable scenarios, and ultimately deliver stronger buy-in and sustained momentum across teams.
Stakeholder feedback enhances three-quarter timeline effectiveness by identifying potential bottlenecks, validating resource allocation assumptions, and ensuring milestone alignment with business priorities. Regular input from departments like finance, operations, and customer service enables project managers to adjust schedules proactively, ultimately delivering more realistic timelines and improved project outcomes.
-
Informative presentations that are easily editable.
-
Enough space for editing and adding your own content.
-
Very unique and reliable designs.
-
Great experience, I would definitely use your services further.
-
Great product with highly impressive and engaging designs.